Your equity curve is just one of the paths your edge could have taken. Monte Carlo resamples your trades thousands of times to show the whole range of futures — and the risks hiding in the tails.
Two accounts with identical stats can feel completely different to trade — one drifts up smoothly, the other nearly blows up first. Monte Carlo reshuffles your trade history thousands of times so you see not just the average, but the bad-luck paths too.
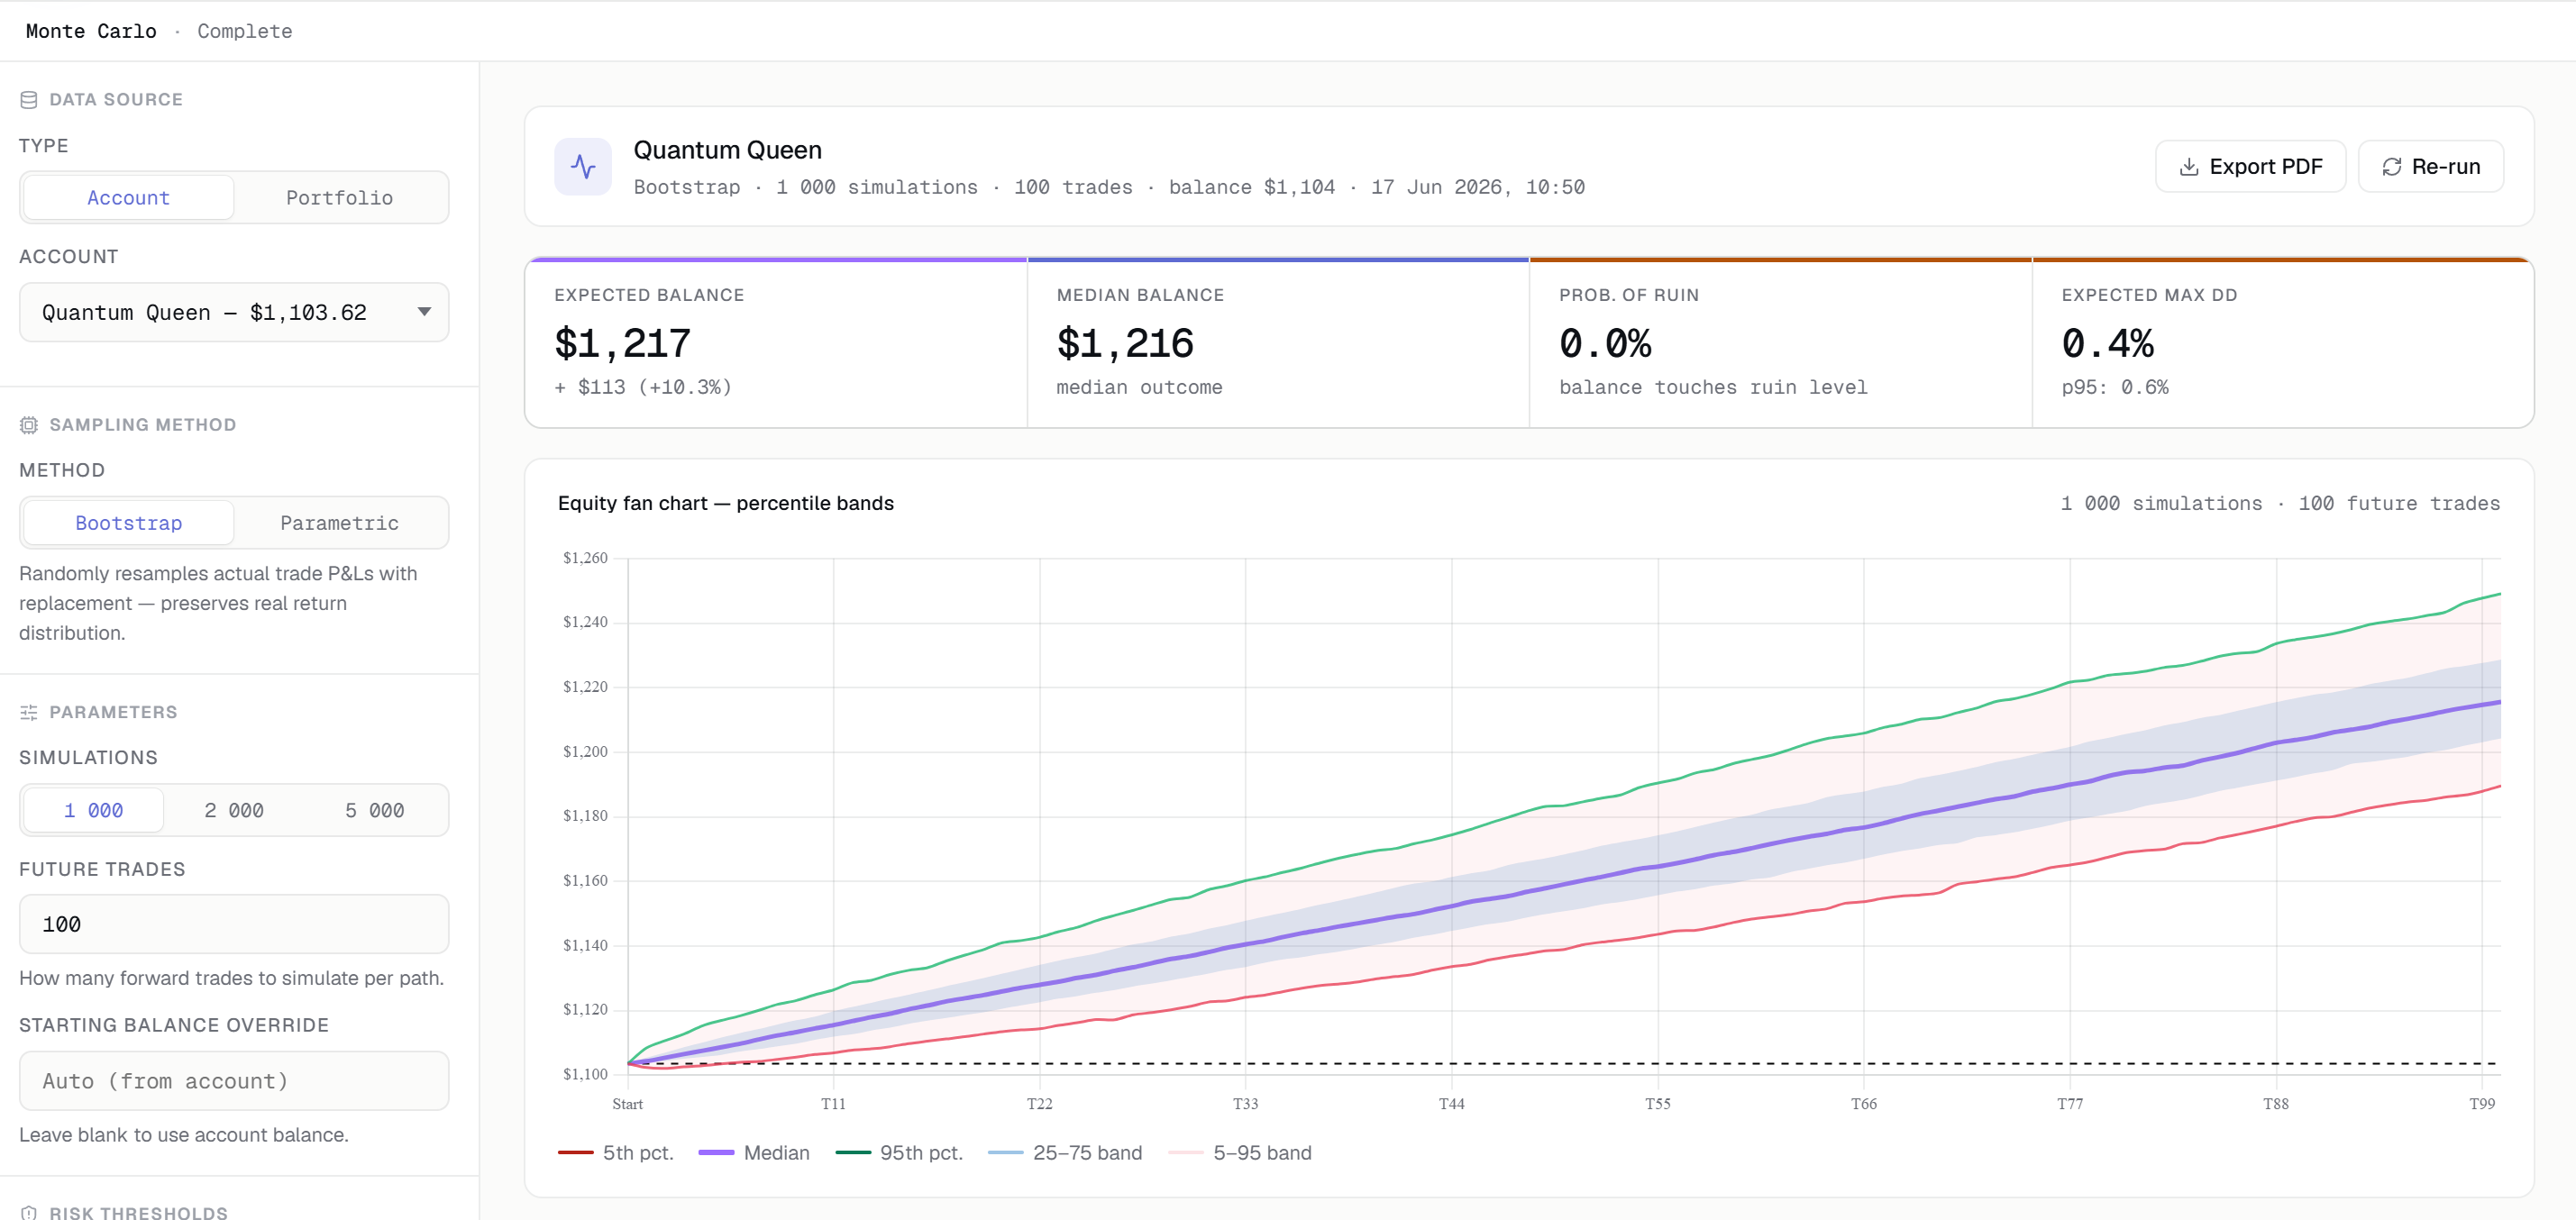
Resample your actual trades to keep their real shape, or model them from their statistical distribution. Run either — or both — on a live account or an uploaded backtest.
A fan chart plots the spread of simulated equity curves with median and percentile bands — alongside a drawdown distribution and a histogram of final balances.
Every run distils down to the questions you actually care about — framed as odds across thousands of simulated futures.
How often you reach your goal across all runs.
How often the account hits your blow-up threshold.
Where you land on average — and at the midpoint.
The drawdown to brace for, plus how often it’s exceeded.
Simulate thousands of futures for your account or backtest. Free to start.
Run a simulation