Unified equity curves
All selected systems are normalized to a percentage of starting capital using the TWRR method and displayed on a single chart. Deposit size becomes irrelevant — you are comparing the shape and growth dynamics, not absolute figures. The period switcher (1M / 3M / 6M / YTD / 1Y / All) instantly rebuilds the entire dashboard for the selected time window.
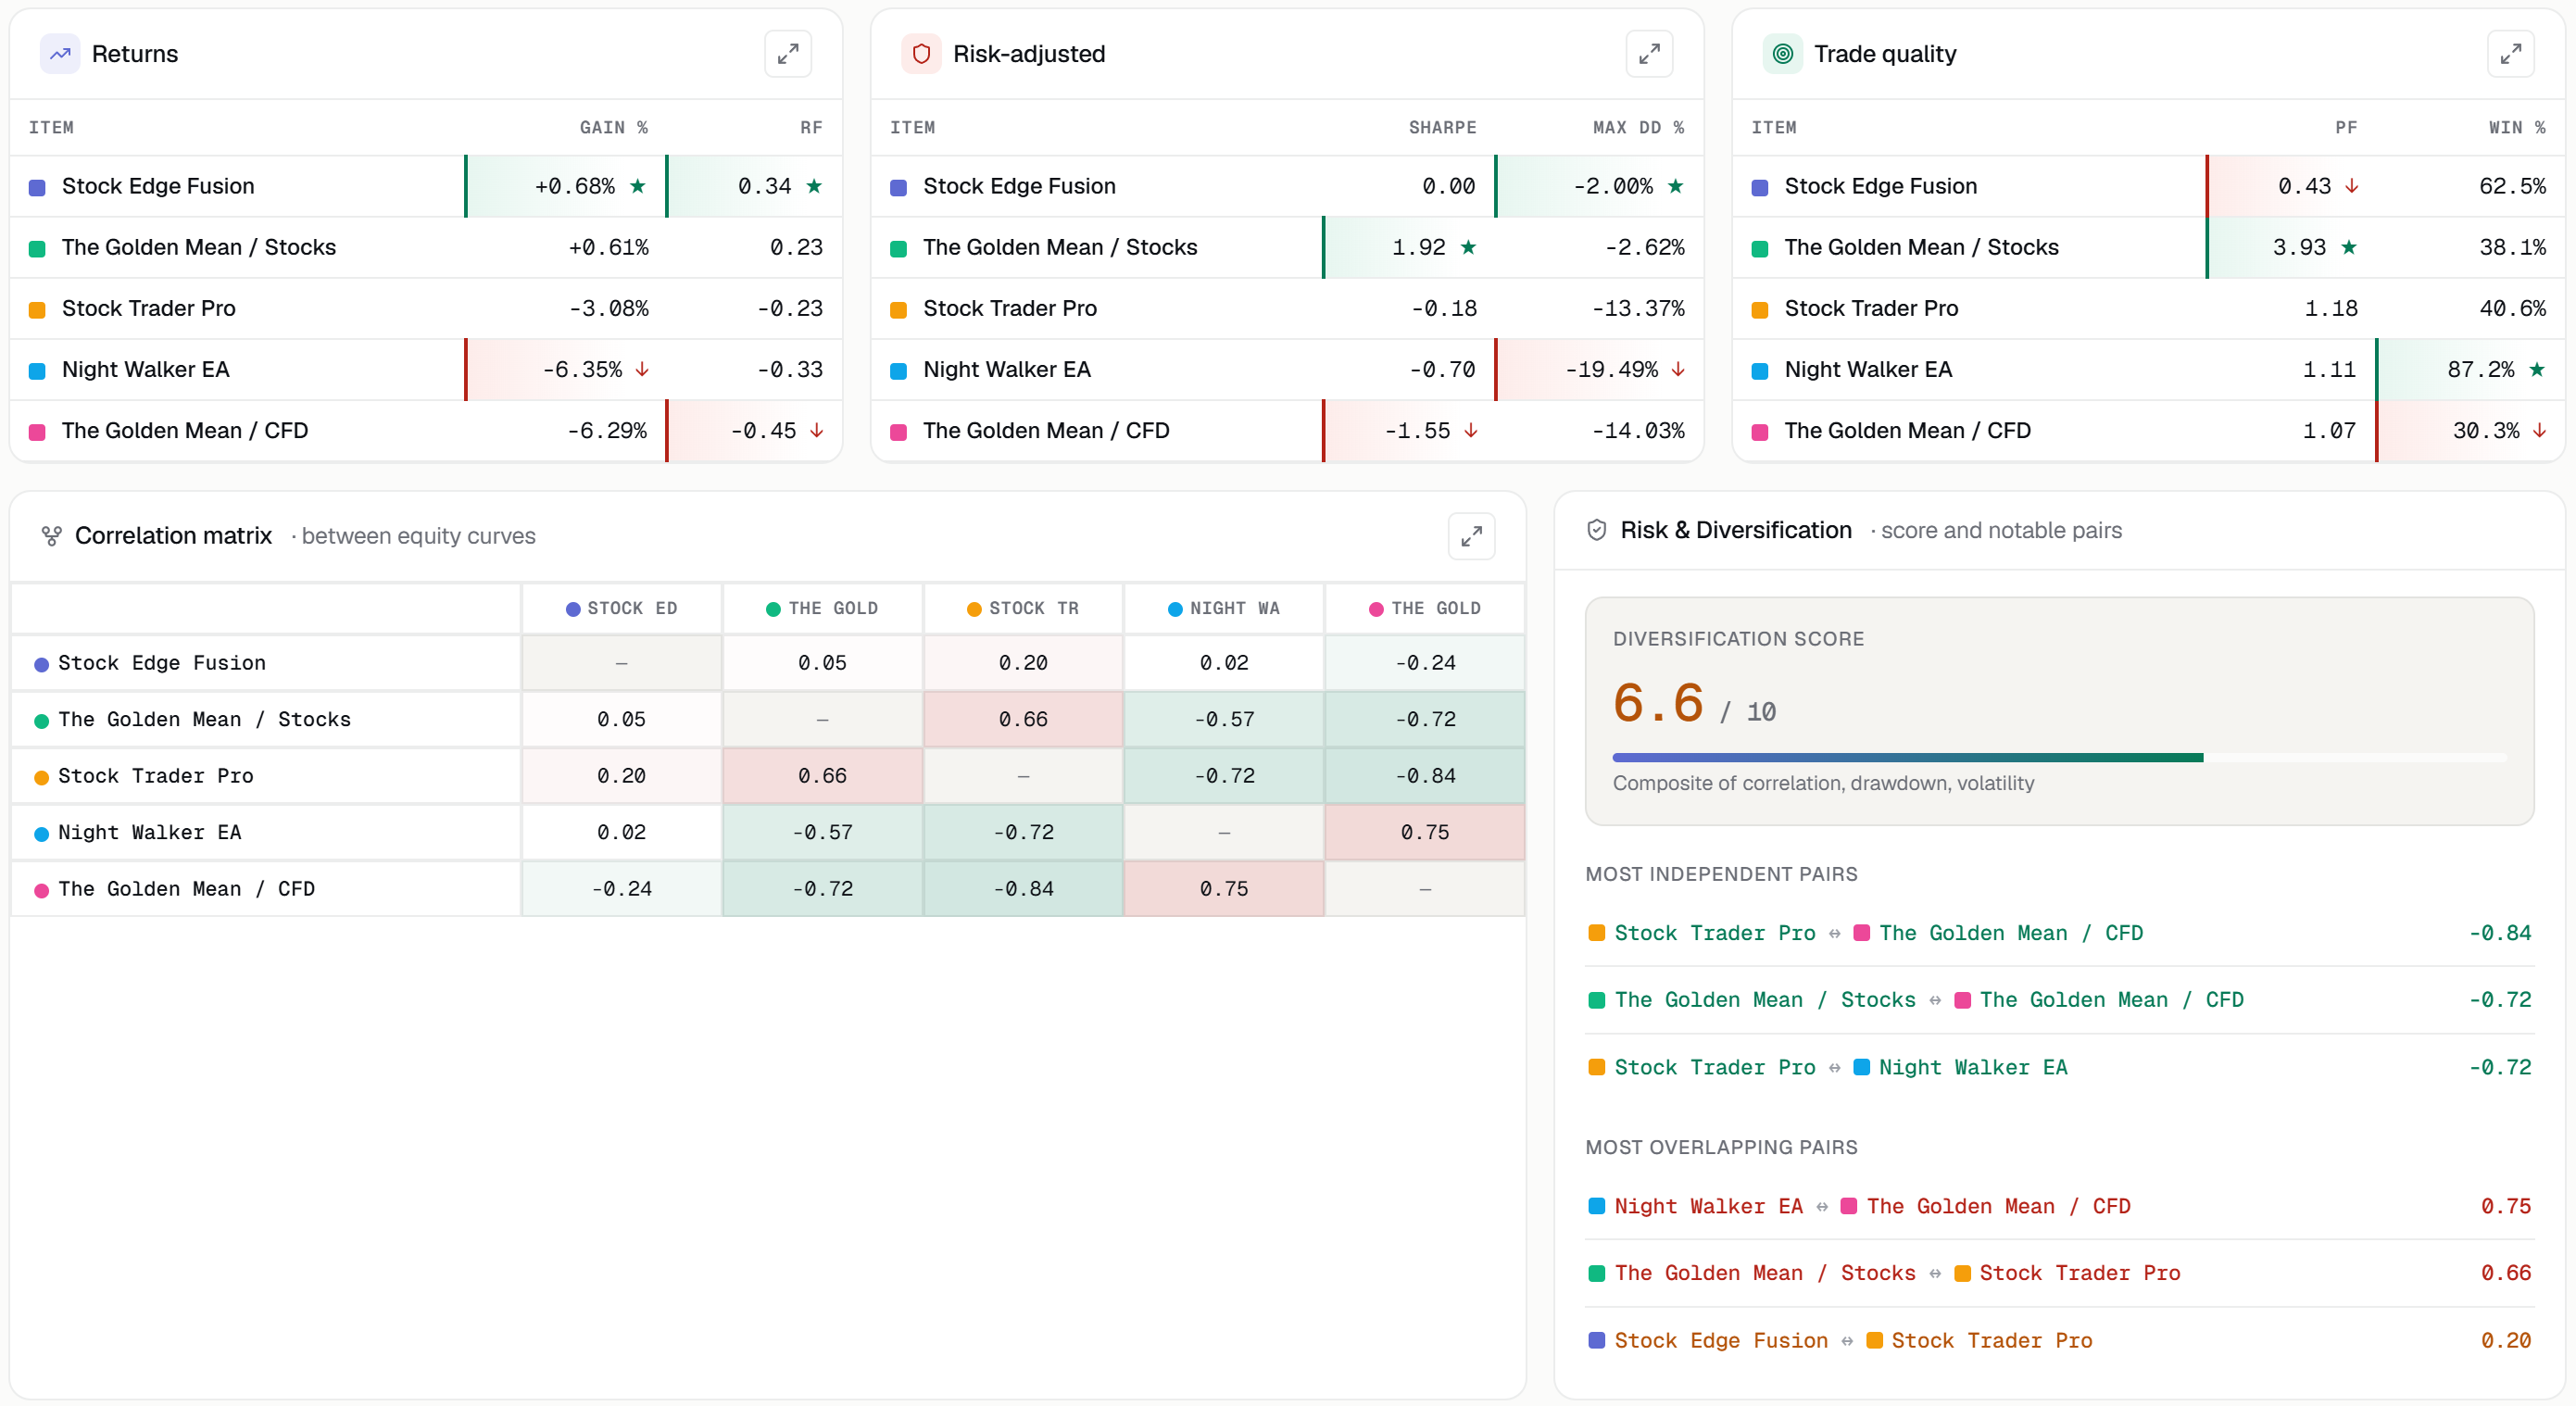
Performance metrics
Each system is broken down into three metric groups:
- Returns — Gain %, Recovery Factor
- Risk-adjusted — Sharpe, Sortino, Calmar, Max Drawdown
- Trade Quality — Profit Factor, Win Rate, Expectancy, trade count
Best and worst values in each column are highlighted automatically, making it easy to identify the strengths and weaknesses of each system at a glance. A full metrics table is available in a modal window.
Correlation matrix
One of the key tools in the section. The matrix shows how synchronously the selected systems move relative to each other. Green indicates independent systems, red indicates correlated ones. If two Expert Advisors produce similar curves and essentially duplicate risk, the matrix will show it immediately. Full-screen mode is available for working with larger datasets.
Diversification Score
A composite score from 0 to 10 reflecting the actual level of diversification of the selected set of systems. The calculation takes into account the average correlation between systems, average drawdown, and the number of elements in the comparison. An important detail: identical or highly correlated systems will score no higher than 1.5 out of 10 — regardless of how stable each one is individually. The score reflects diversification, not the quality of individual strategies.
Monthly return heatmap
All systems in a single table broken down by month. You can immediately see which EA underperformed in a given month, which portfolio offset the drawdown, and where all systems experienced a simultaneous drawdown. Horizontal scrolling is available for long histories, with a full-screen mode for detailed analysis.
What can be compared
The section supports any combination of objects:
- Trading accounts (MT4 / MT5, including cent accounts)
- Account portfolios with multipliers
- Backtests and backtest portfolios
- EA groups by Magic Number
- Mixed sets combining any of the above (Mixed Mode)
Availability
The section is available from the Trader plan and above. The number of comparisons and elements within each is unlimited. If you haven't tried FX Monitor yet — take advantage of the free 14-day trial to explore the full capabilities of the section.