Your month, explained.
A finished document, not another dashboard. When the period closes, FX Monitor issues a report across every real account — figures, charts and a plain-language breakdown of where the result actually came from.
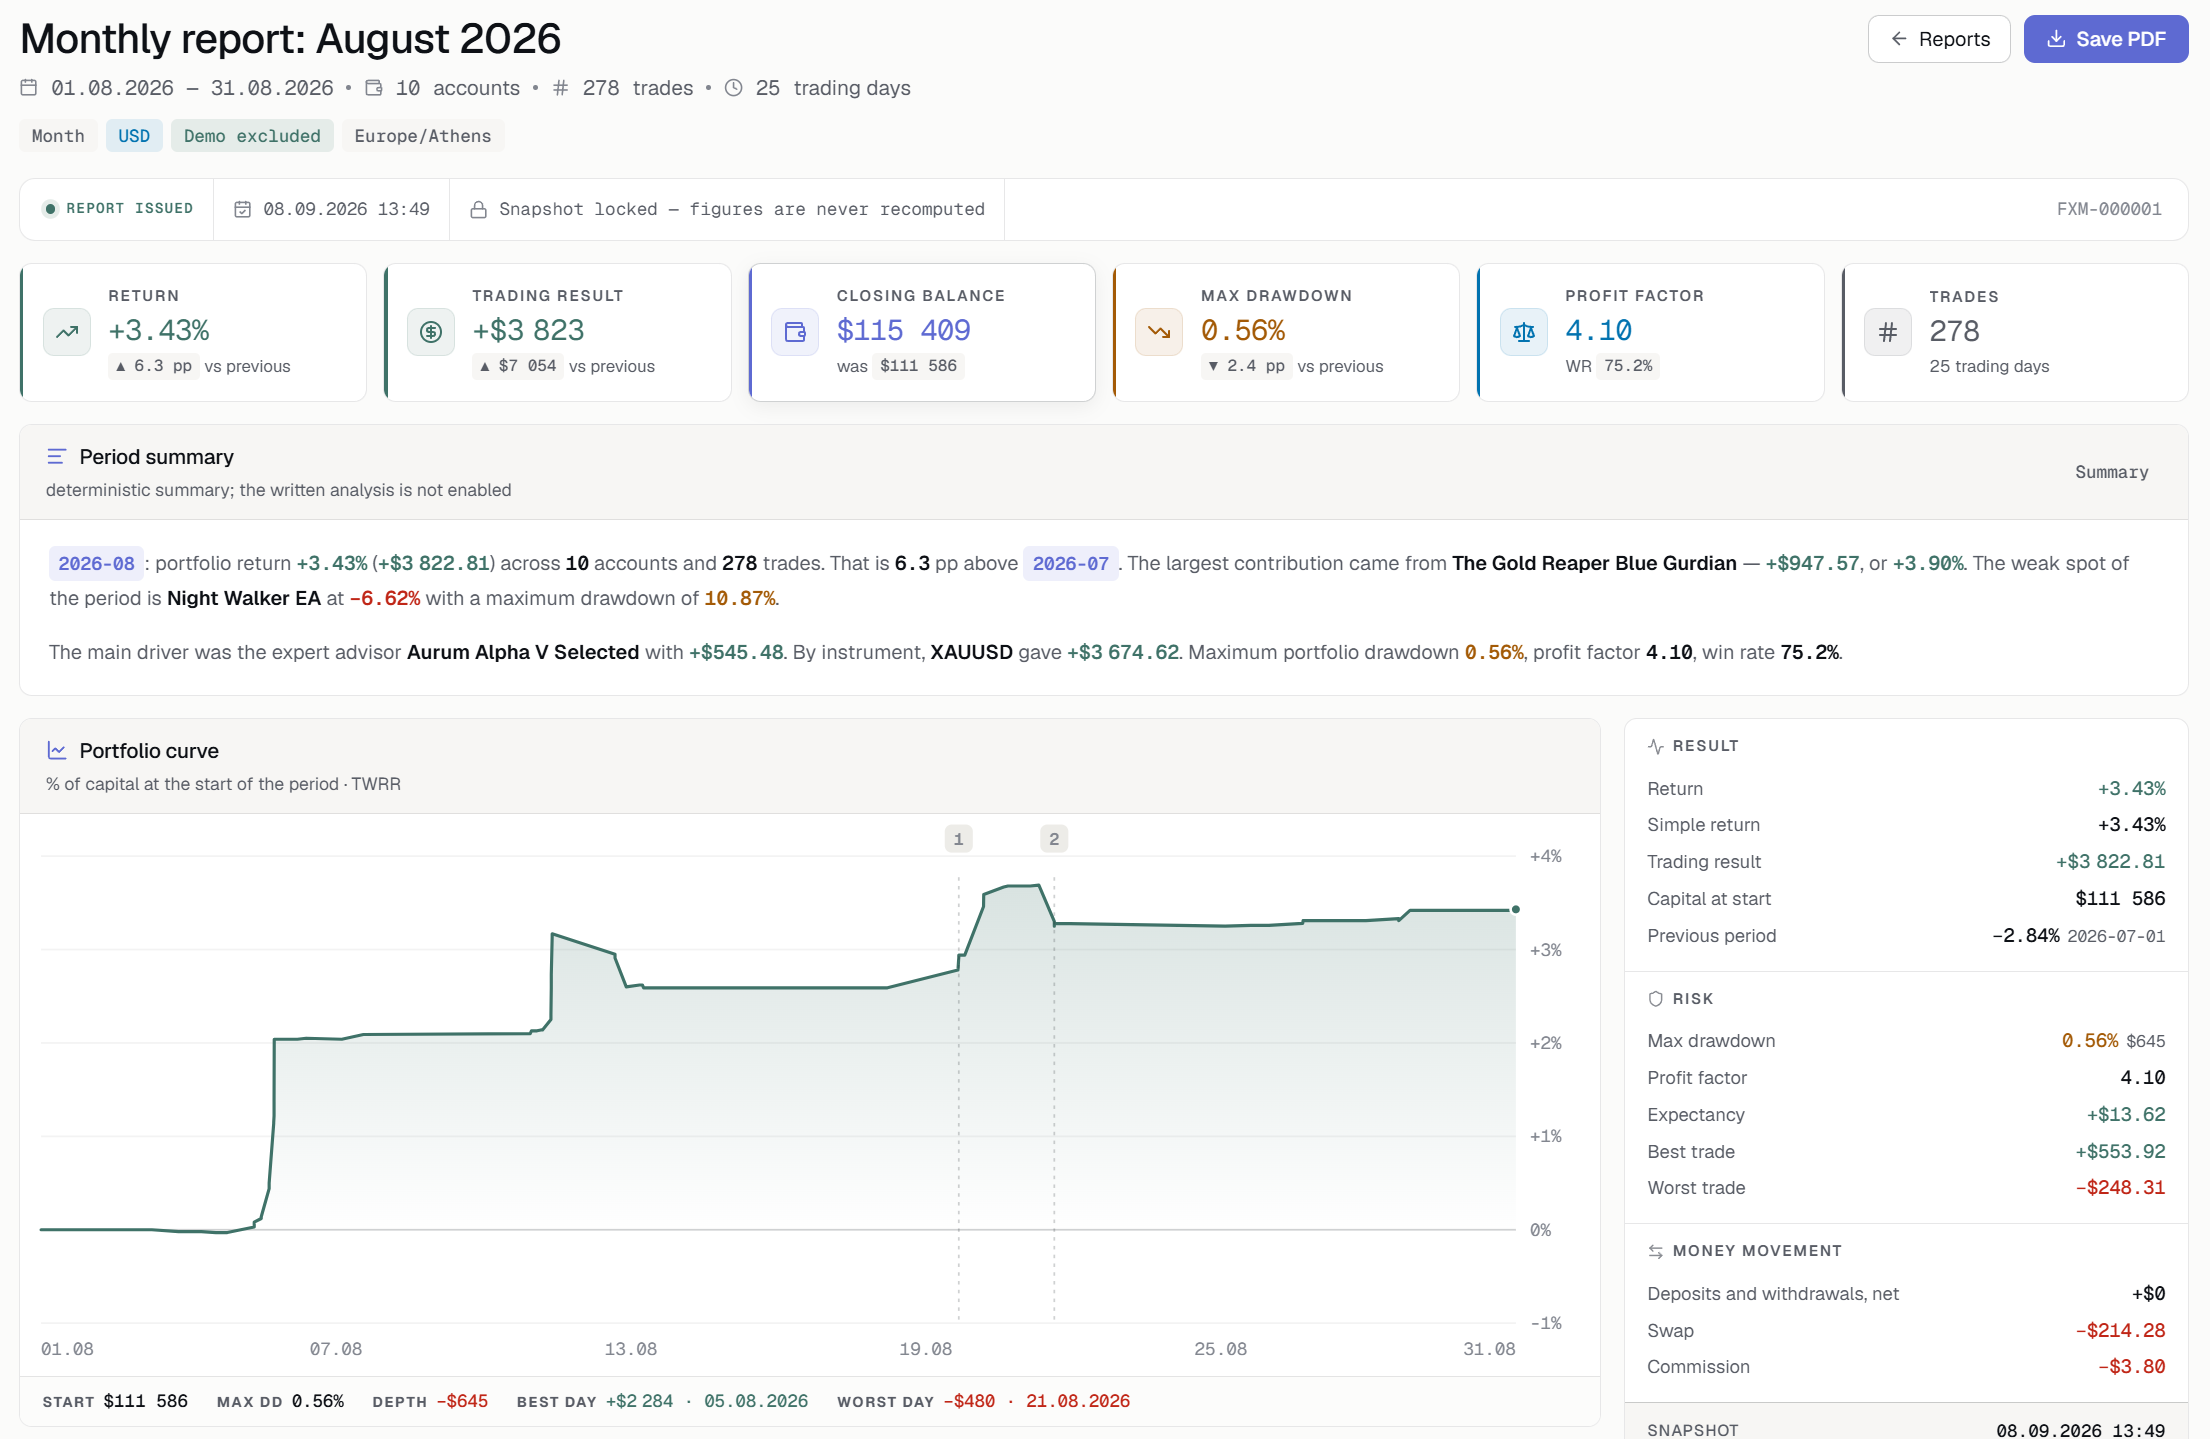
A dashboard shows now. A report explains what happened.
Live numbers answer “where am I”. They never answer “why did the month go that way”. A report closes the period, ranks what actually mattered and says it in sentences — so you read the result instead of assembling it yourself.
Four steps, none of them yours
The period closes
Boundaries are cut in your own timezone, with a few hours of grace so the last trades of the period arrive first.
The figures are computed
Return, drawdown, profit factor and the breakdowns — by the same formulas the rest of the portal uses, so nothing disagrees with your dashboard.
The analysis is written
A language model turns the ranked facts into two paragraphs and a few observations. It never touches the numbers themselves.
It arrives
Email or Telegram with the headline figures and a link. The document lives in your archive and saves to PDF in one click.
One document, the whole period
Everything a review needs, in the order you would ask for it.
Verdict and summary
The period result against the previous one, and two paragraphs on where it came from.
Where the balance moved
Trading result kept separate from deposits and from money brought in by newly connected accounts.
By account, EA and instrument
Three breakdowns, each row carrying its contribution to the portfolio result in percentage points.
Costs
Swap and commission on their own line, so you can see what execution took.
Events of the period
Accounts connected, expert advisors started or gone quiet, your own changelog entries — marked on the curve.
The period in context
Month-by-month return around the period, so a good month is visible as a good one.
Numbers you can rely on
A report never changes
Each one stores a snapshot taken at issue time. Statistics recomputed later, or accounts archived, never move the figures in an old report.
The model cannot invent a number
The text is written with placeholders and the server substitutes the computed values. An answer containing a figure of its own is rejected and replaced by a plain summary.
Statements, not advice
A report says what happened and how much it mattered. It does not tell you what to trade next.
Your language, your currency
The document is issued in the language and display currency you choose, and both are fixed into the snapshot.
Let the month explain itself.
Connect your accounts and get your first report when the period closes. Free to start.