Every account, as one.
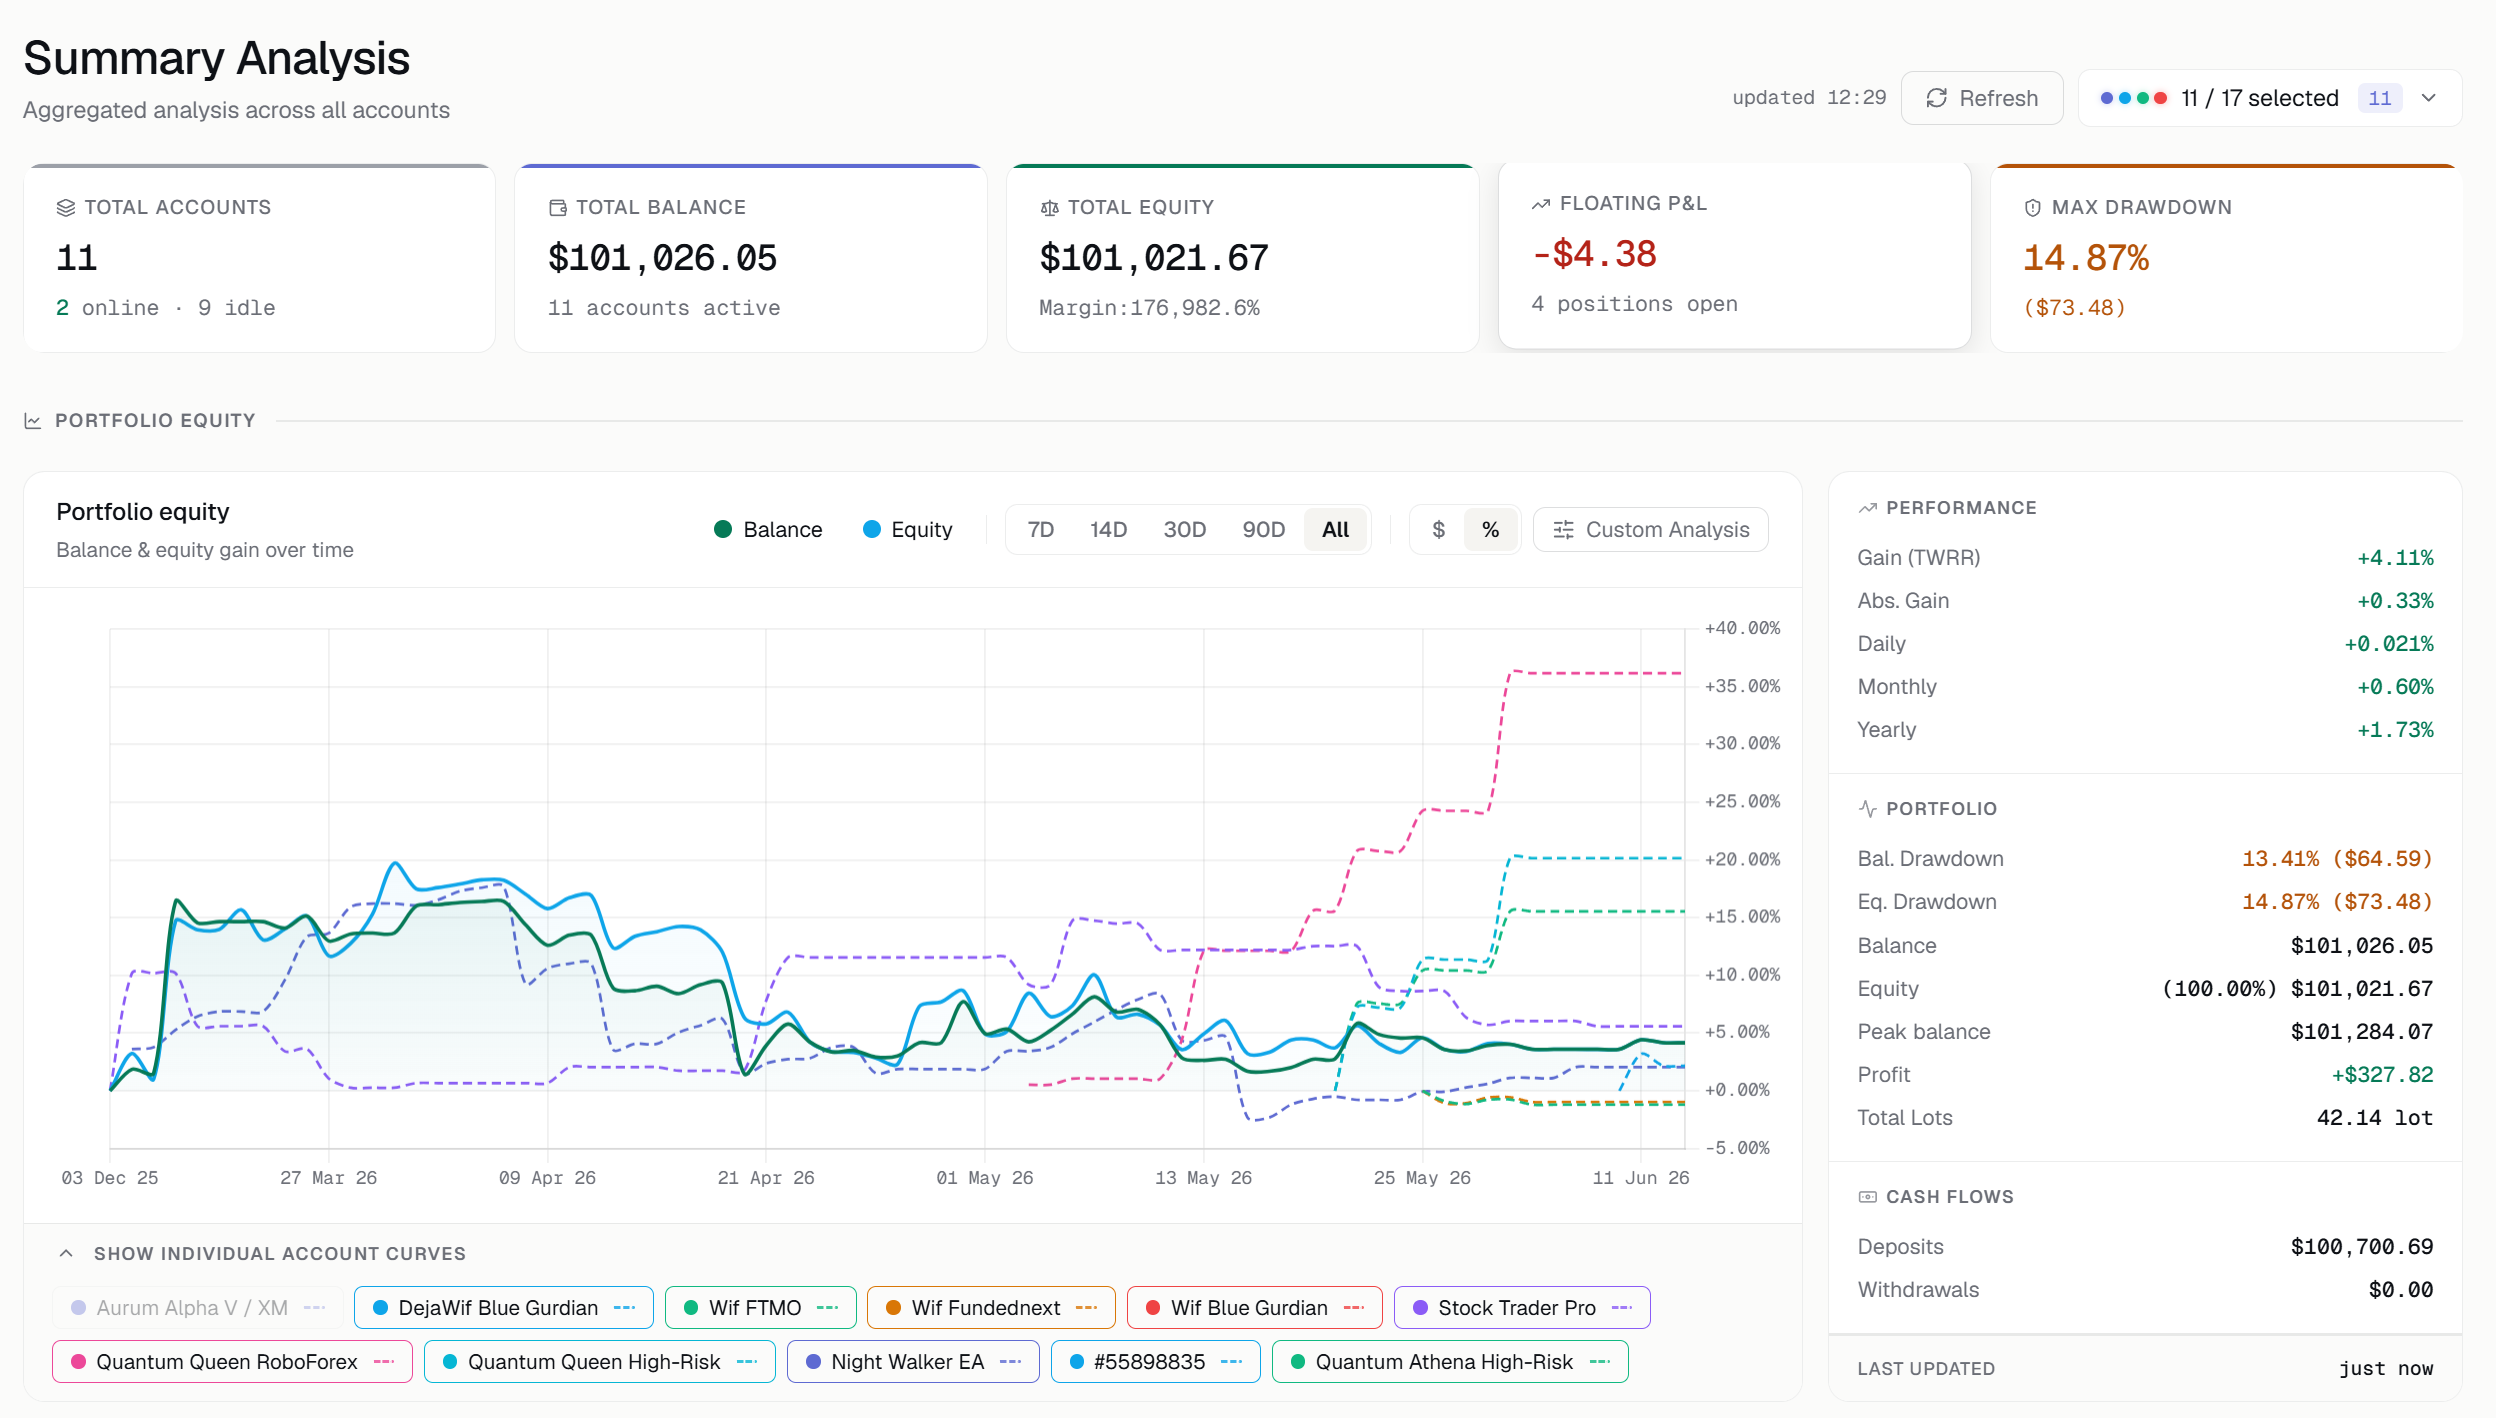
Stop adding up accounts in your head. Summary Analysis rolls every connected account into one dashboard — combined equity, portfolio KPIs, a monthly heatmap and one filterable trade list.
Your first insight in minutes
Your real account is all of them combined
If you trade more than one account, none of them on its own tells you how you’re actually doing. Summary Analysis aggregates them into a single portfolio view — the number that really matters, plus the breakdown behind it.
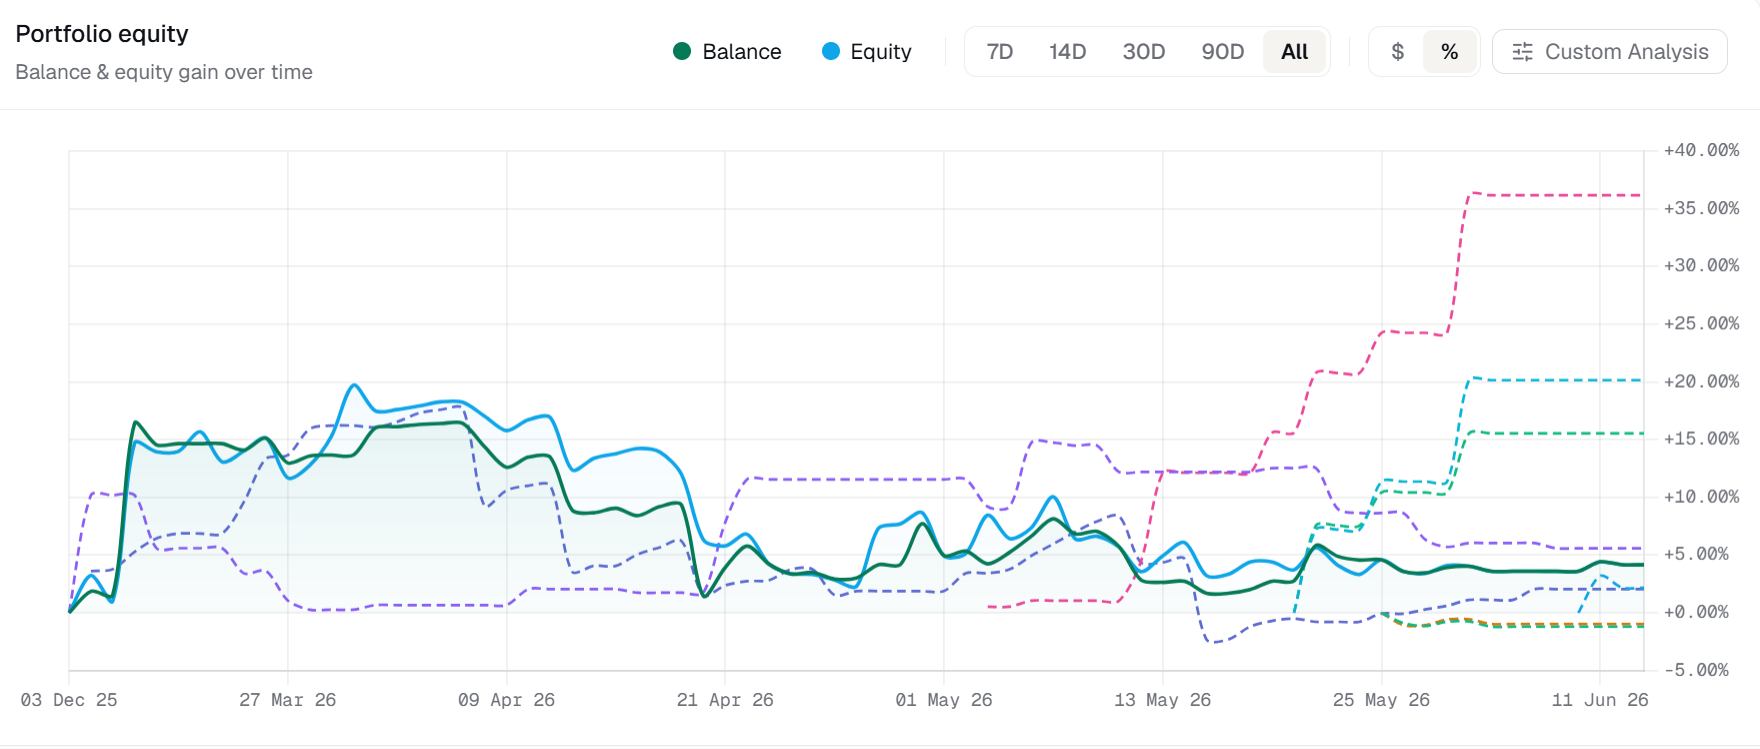
One curve for everything you trade
A single equity curve and a row of portfolio KPIs sum up every connected account — total balance, equity, net P&L, win rate and drawdown — so your true standing is one glance away.
- Aggregated equity & balance curve across all accounts
- Portfolio KPIs: P&L, win rate, profit factor, drawdown
- Live totals that update as trades close
See your year at a glance
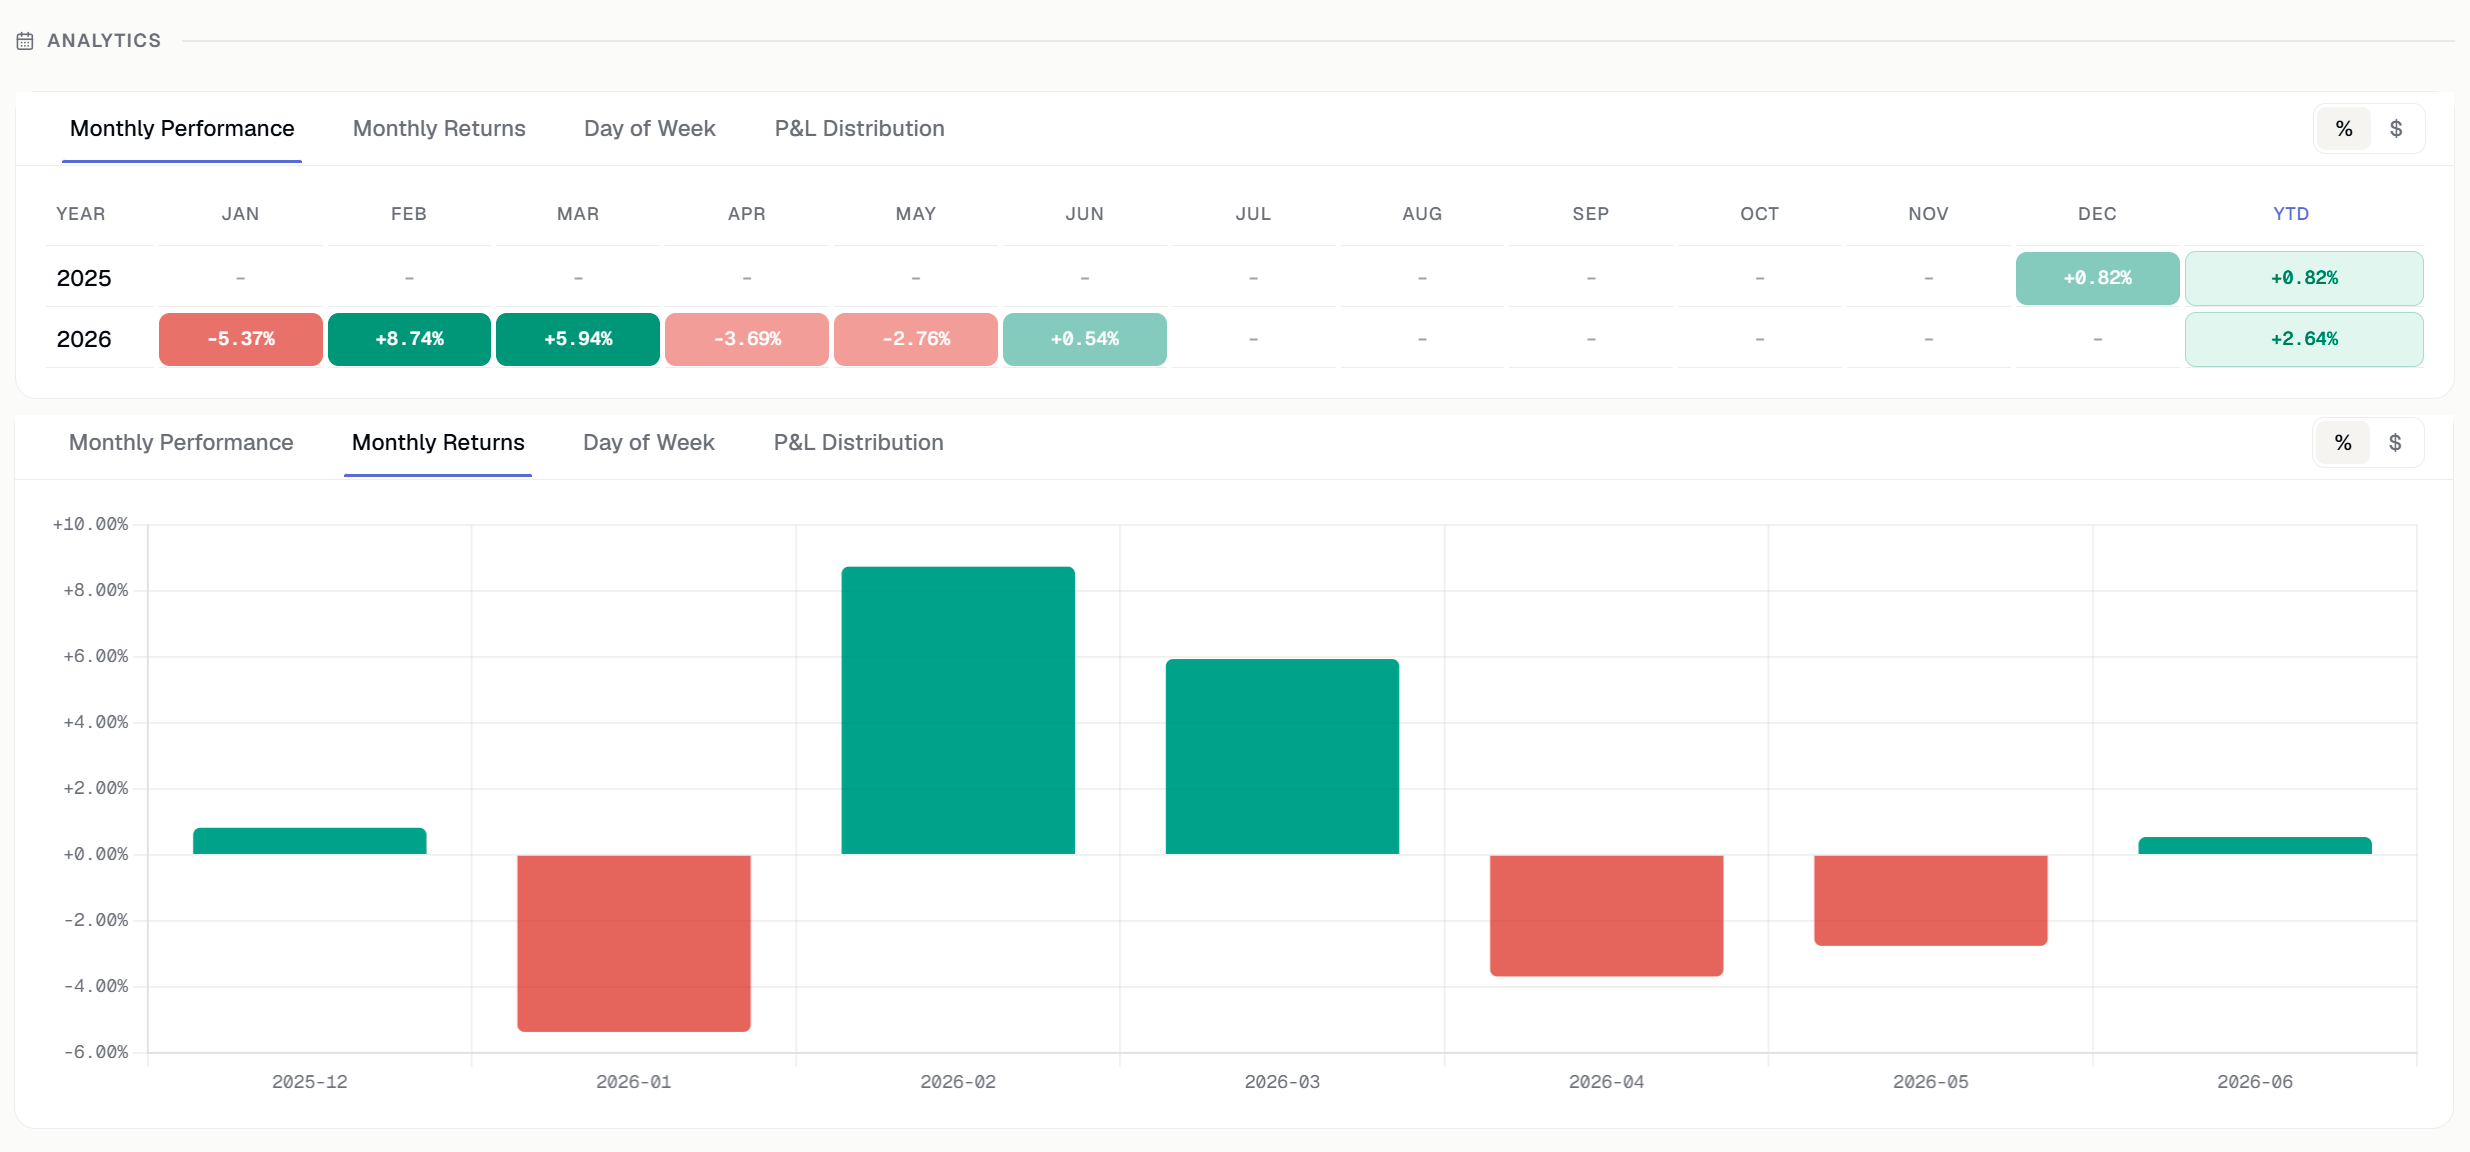
A month-by-month performance heatmap colours your good and bad stretches across the whole portfolio — so seasonality and rough patches jump straight out.
- Month-by-month P&L across all accounts
- Spot seasonality and drawdown periods instantly
- Drill from a month into the trades behind it
From the total down to one trade
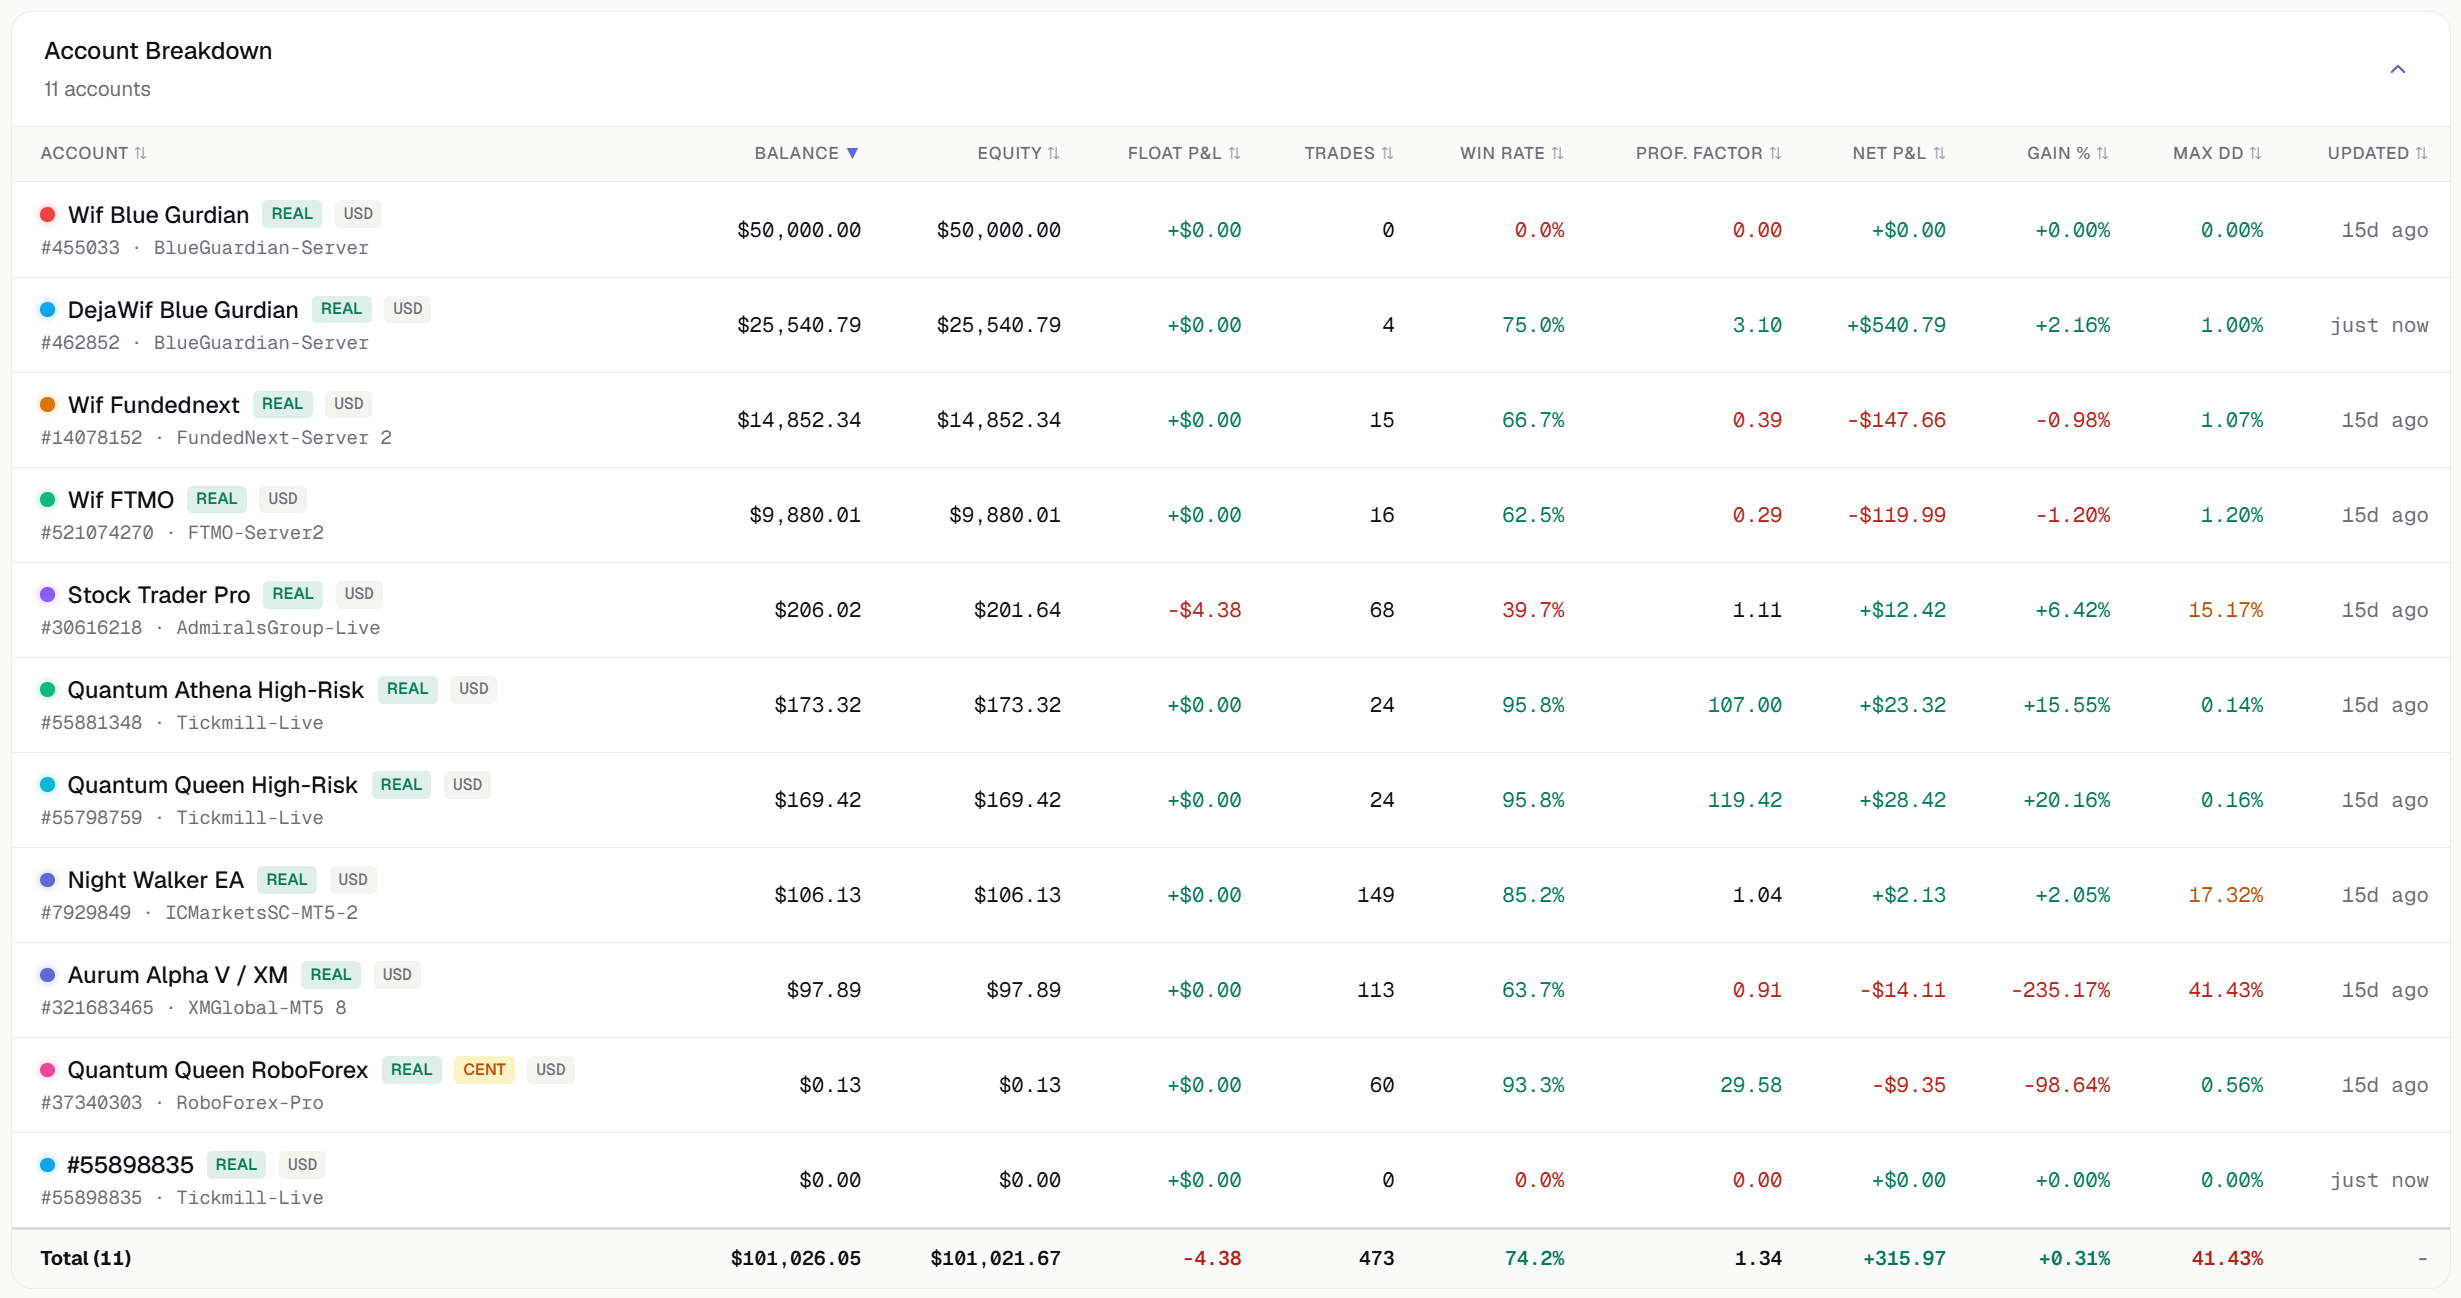
A per-account breakdown shows who’s pulling their weight, and a single filterable trade list spans every account at once — search, sort and filter without switching screens.
- Per-account contribution breakdown
- One trade list across every connected account
- Filter and sort by symbol, EA, date and result
Everything, rolled up
Combined equity curve
All accounts on one curve, not a folder of tabs.
Portfolio KPIs
The headline numbers for your trading as a whole.
Monthly heatmap
A colour map of every month across the portfolio.
Unified trade list
Every trade from every account, filterable in one place.
See how you’re really doing.
Connect your accounts and get one dashboard for all of them. Free to start.