Put them head to head.
Compare accounts, portfolios, backtests and EAs side by side — every metric in one table, best and worst highlighted, so the winner is obvious at a glance.
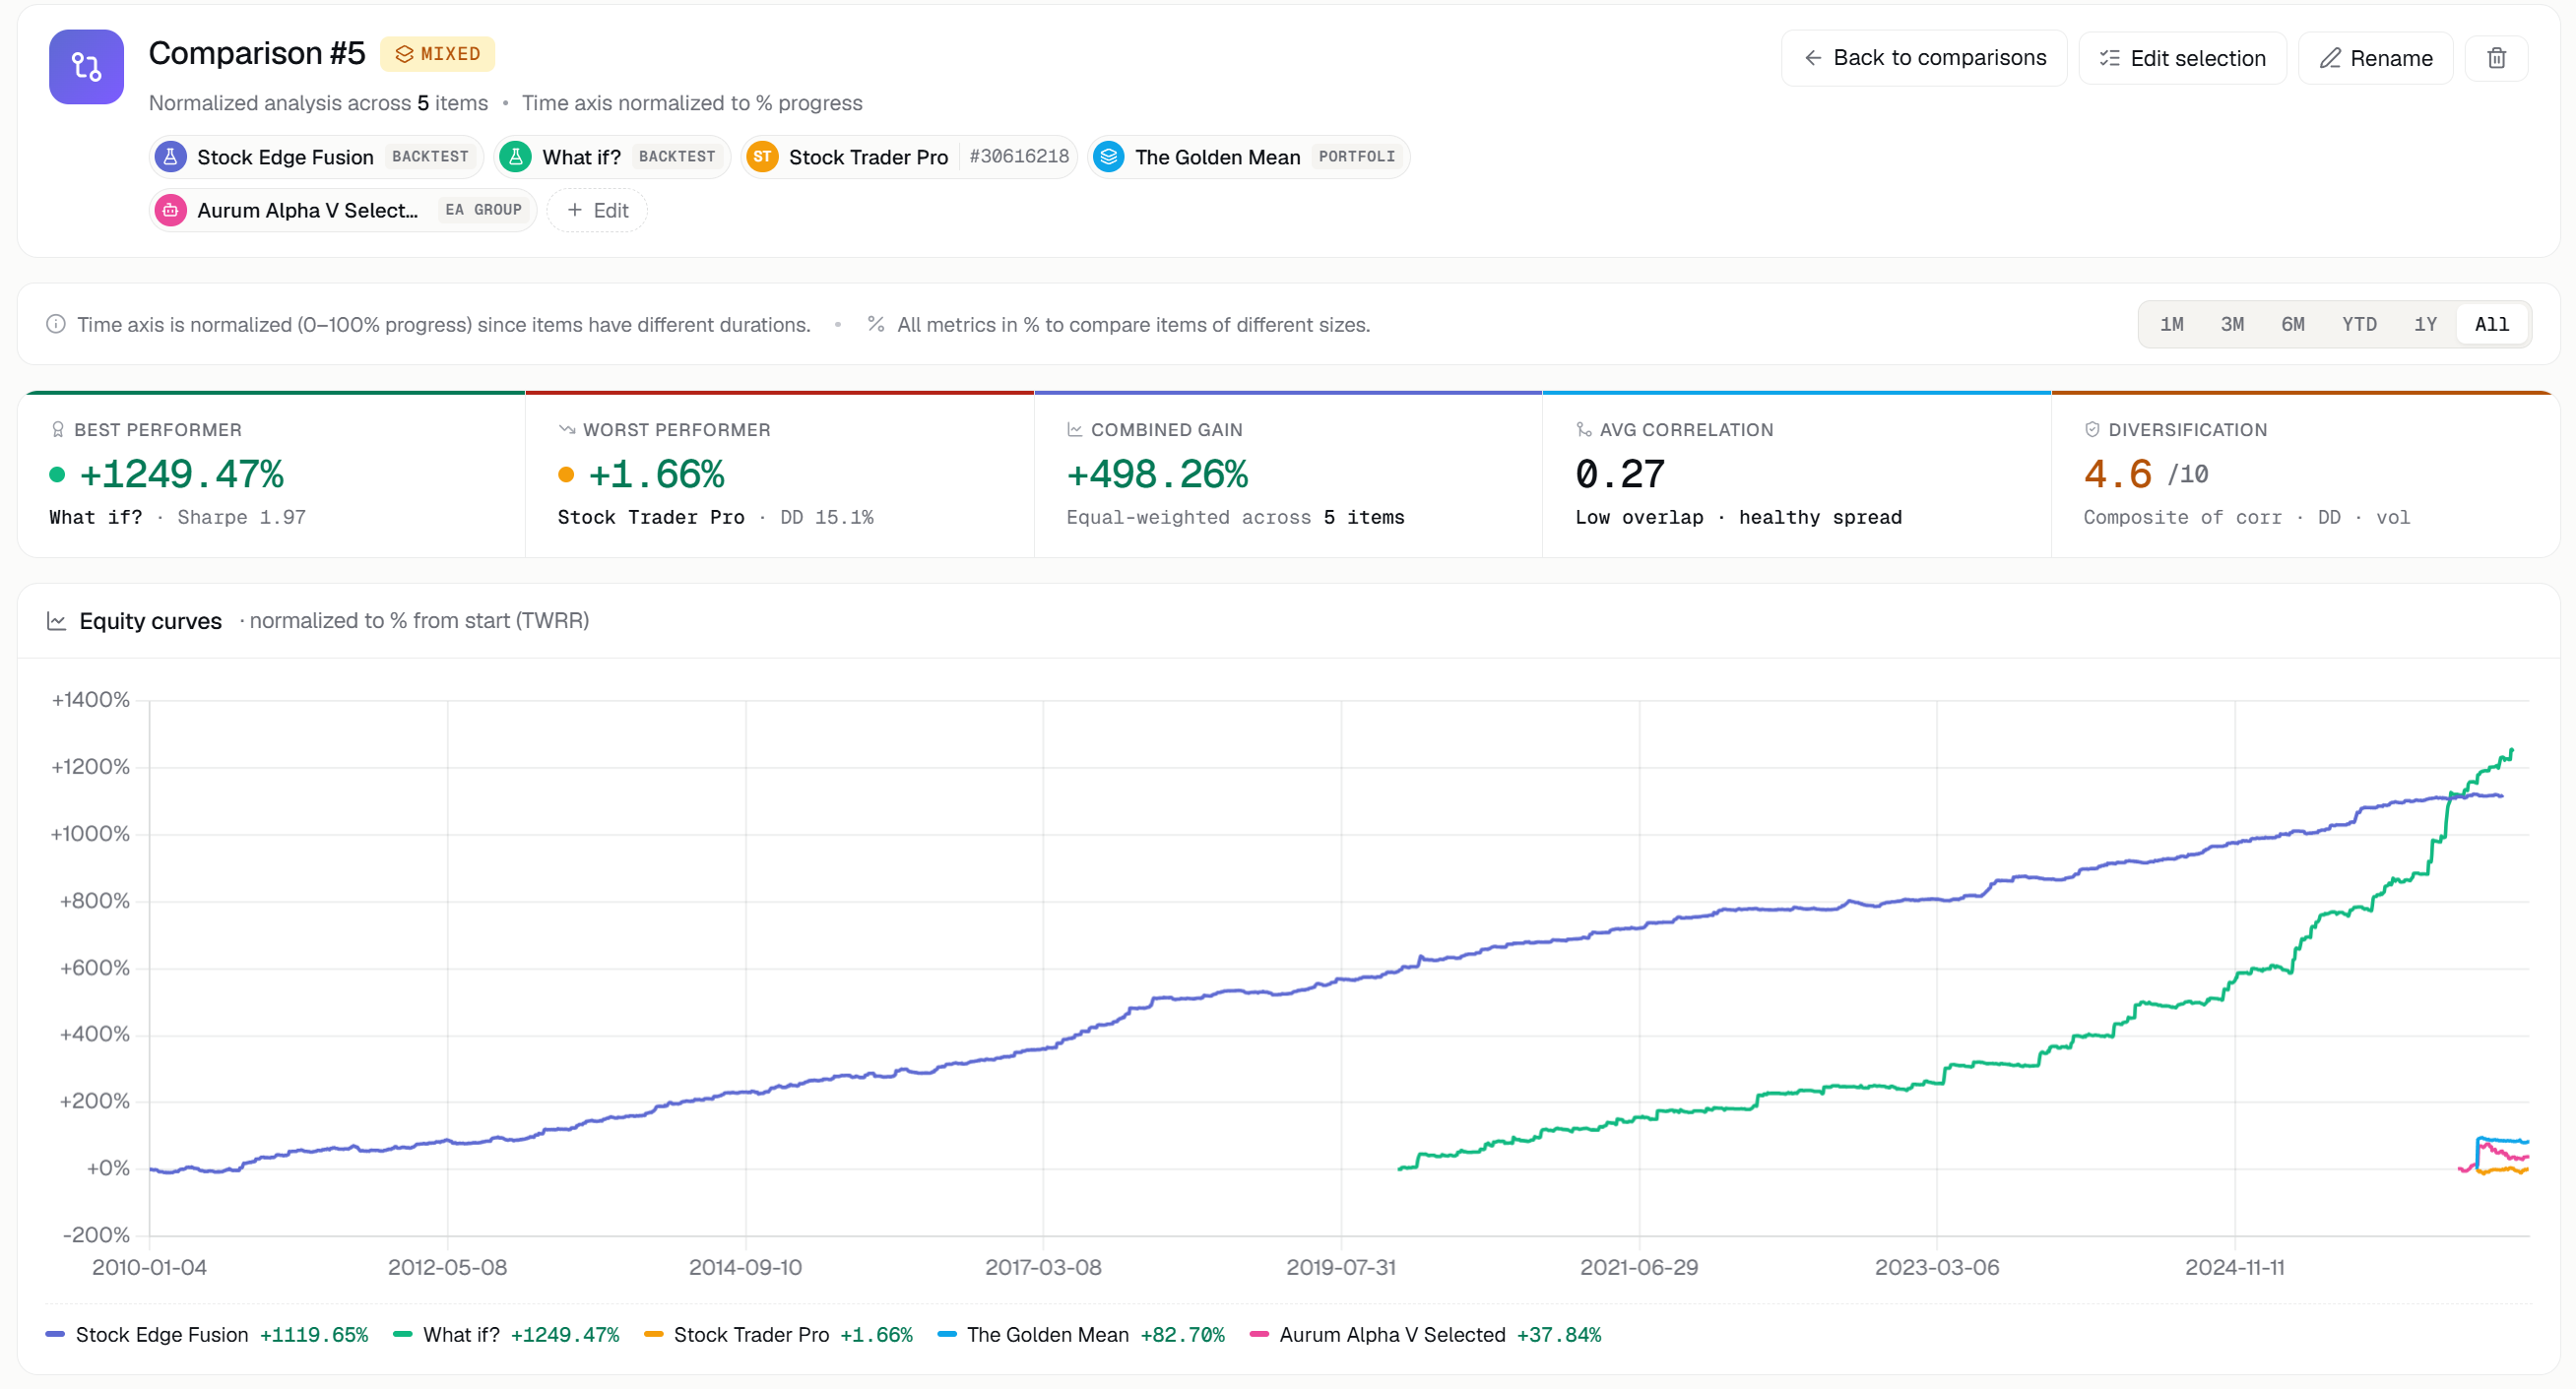
Pick the winner with confidence.
Stop comparing in your head
Flipping between tabs to remember which account had the better Sharpe is how good options get overlooked. Comparative Analysis lines them all up in a single metric table — and even lets you mix entity types in one comparison.
The whole field, one table
Add up to several items and every metric lines up in columns — net P&L, profit factor, drawdown, Sharpe, win rate and more. Each item is colour-coded so a row is easy to read across.
- Every metric, every item, in aligned columns
- Best and worst per row highlighted automatically
- Stable colour coding per item across the page
Compare apples to portfolios
You’re not limited to one kind of thing. Stack a live account against a backtest, an EA against a whole portfolio — FX Monitor normalises them onto the same metrics so the comparison stays fair.
- Accounts, portfolios, backtests, BT portfolios and EAs
- Mixed-mode: combine different entity types freely
- Save a comparison set and reopen it any time
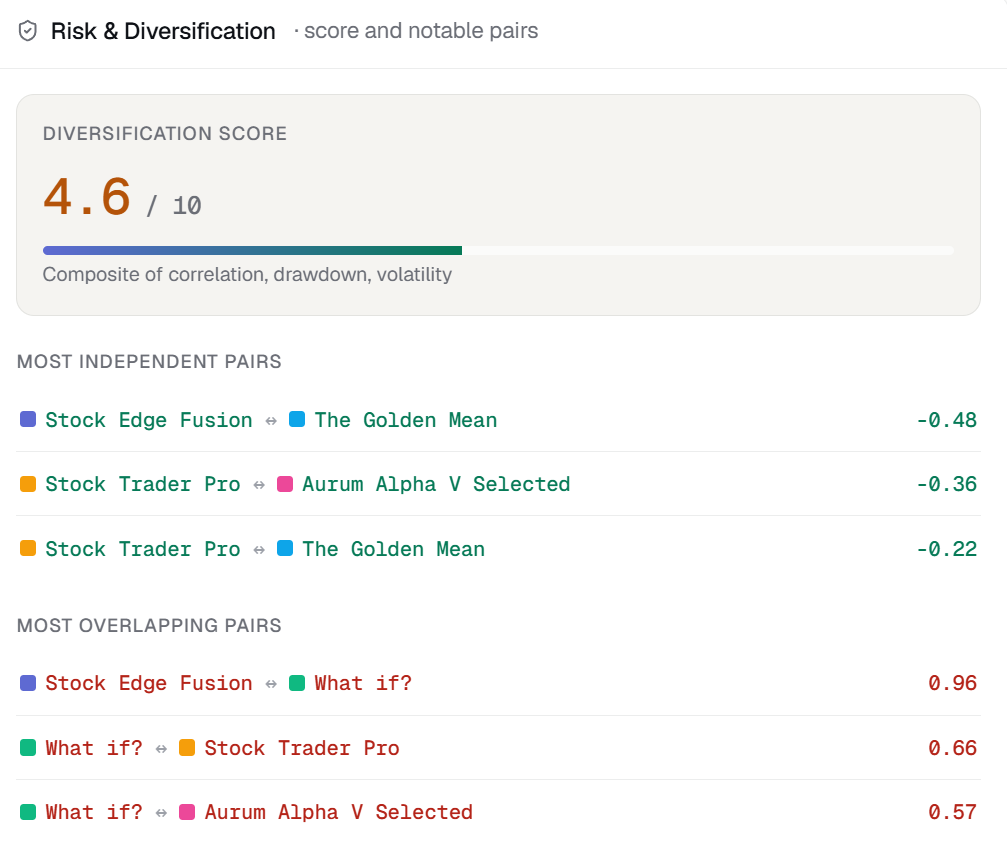
See the difference, don’t just read it
Beyond the numbers, overlay equity curves and distributions so two strategies that share a bottom line but get there very differently can’t hide it.
- Equity curves overlaid on one chart
- Distribution and drawdown shapes compared
- Spot which one is steadier, not just bigger
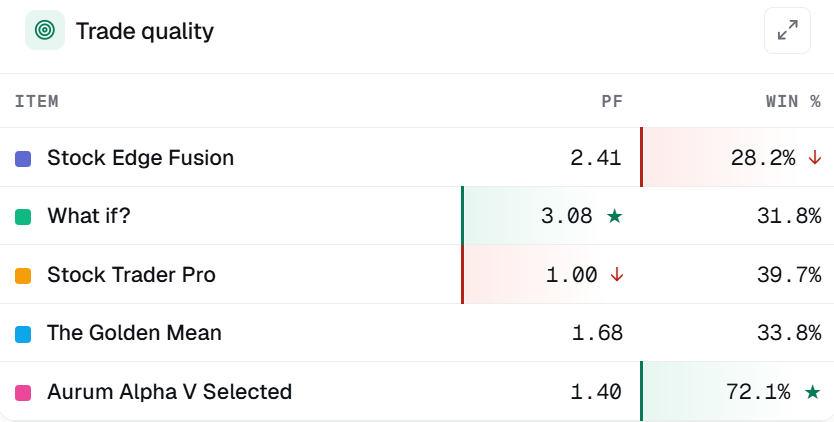
Anything you’ve got, against anything else
Live accounts
Two brokers running the same EA — which fills you better?
Portfolios
Compare whole multi-account portfolios as single units.
Backtests
Stack candidate strategies before you trade any of them.
Expert Advisors
Rank your EAs head-to-head on the metrics that matter.
Pick the winner with confidence.
Line up your accounts, backtests and EAs and let the numbers settle it. Free to start.