Ranked on the accounts of the people who bought them
Every product carries two independent sets of numbers: what the author shows on their own accounts, and what buyers actually got. The second one the author cannot touch — they can neither add an account to it nor remove an inconvenient one.
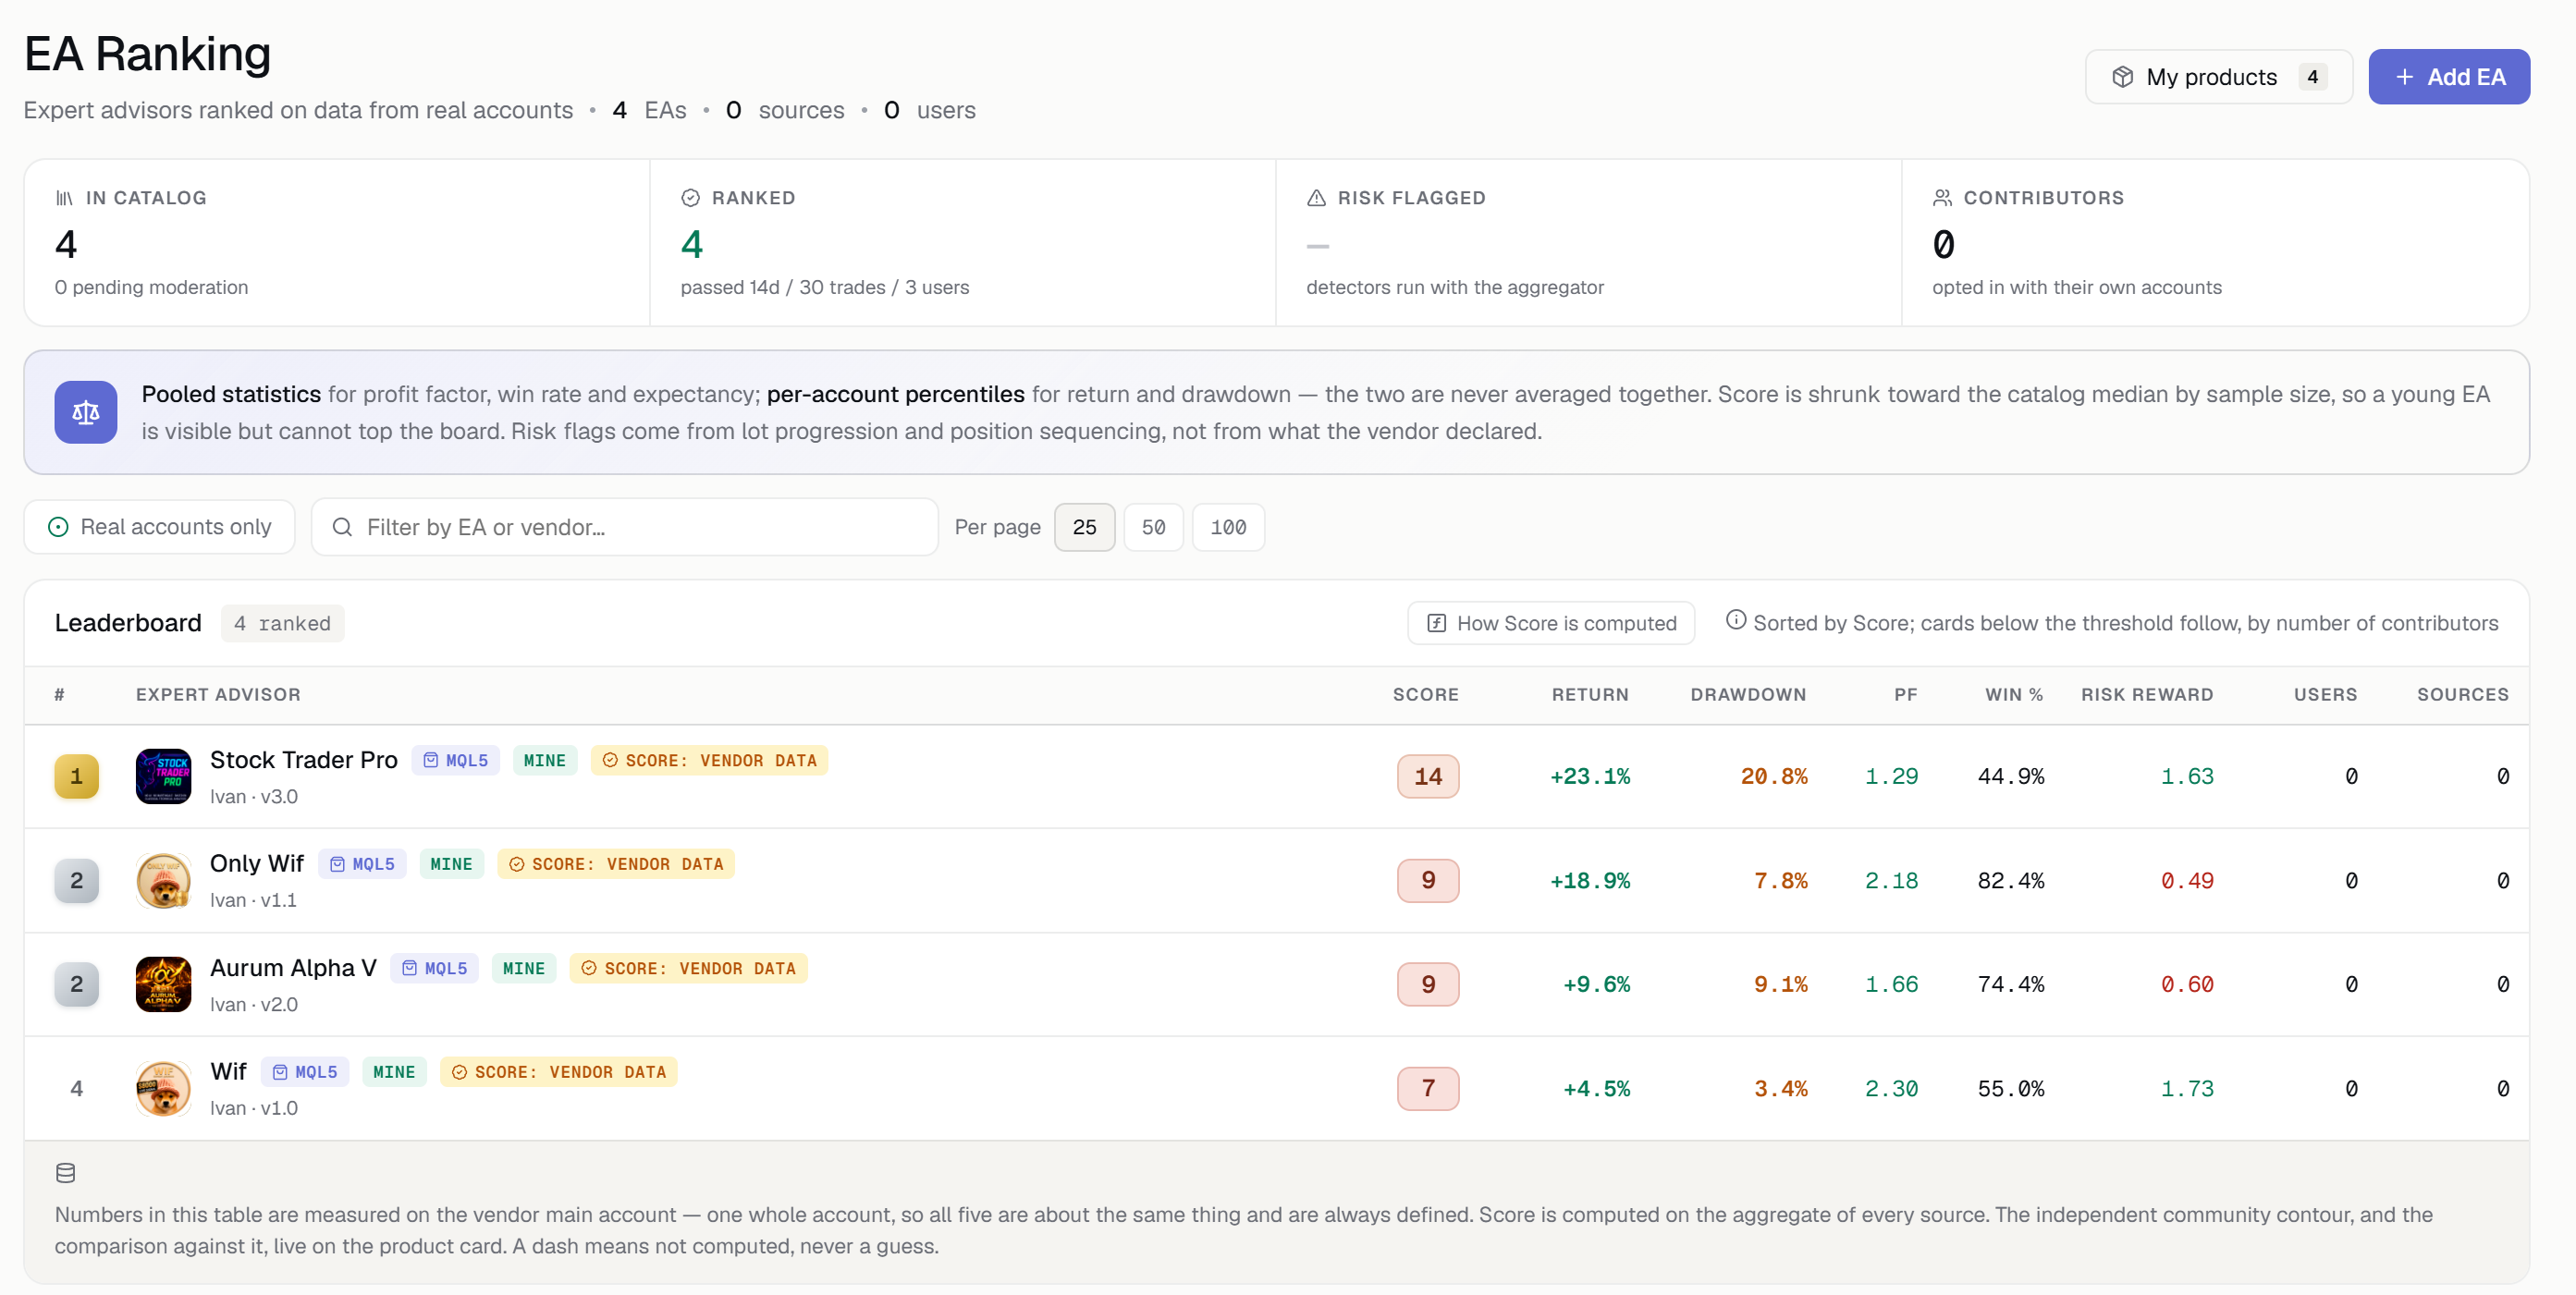
Look at the second column
A seller cannot be checked before you pay
The market for expert advisors is built so that the only evidence available before purchase is supplied by the person selling. Four consequences follow, and every one of them costs the buyer money.
The monitoring is run by the seller
The account on display was chosen by the author — and chosen after the result was already known. Ten accounts traded, one is shown.
Demo passed off as trading
Without slippage, requotes and real execution a demo result says nothing about an EA. In this ranking demo accounts are not accepted at all.
Mechanics hidden behind words
«Scalper», «intelligent algorithm», «proprietary position management» — any of these can be a martingale that draws a flat curve for six months and closes the account in a day.
Reviews are not data
Whoever lost money more often leaves quietly than writes an analysis. The loudest voice is rarely the representative one.
Two contours, and the second matters more
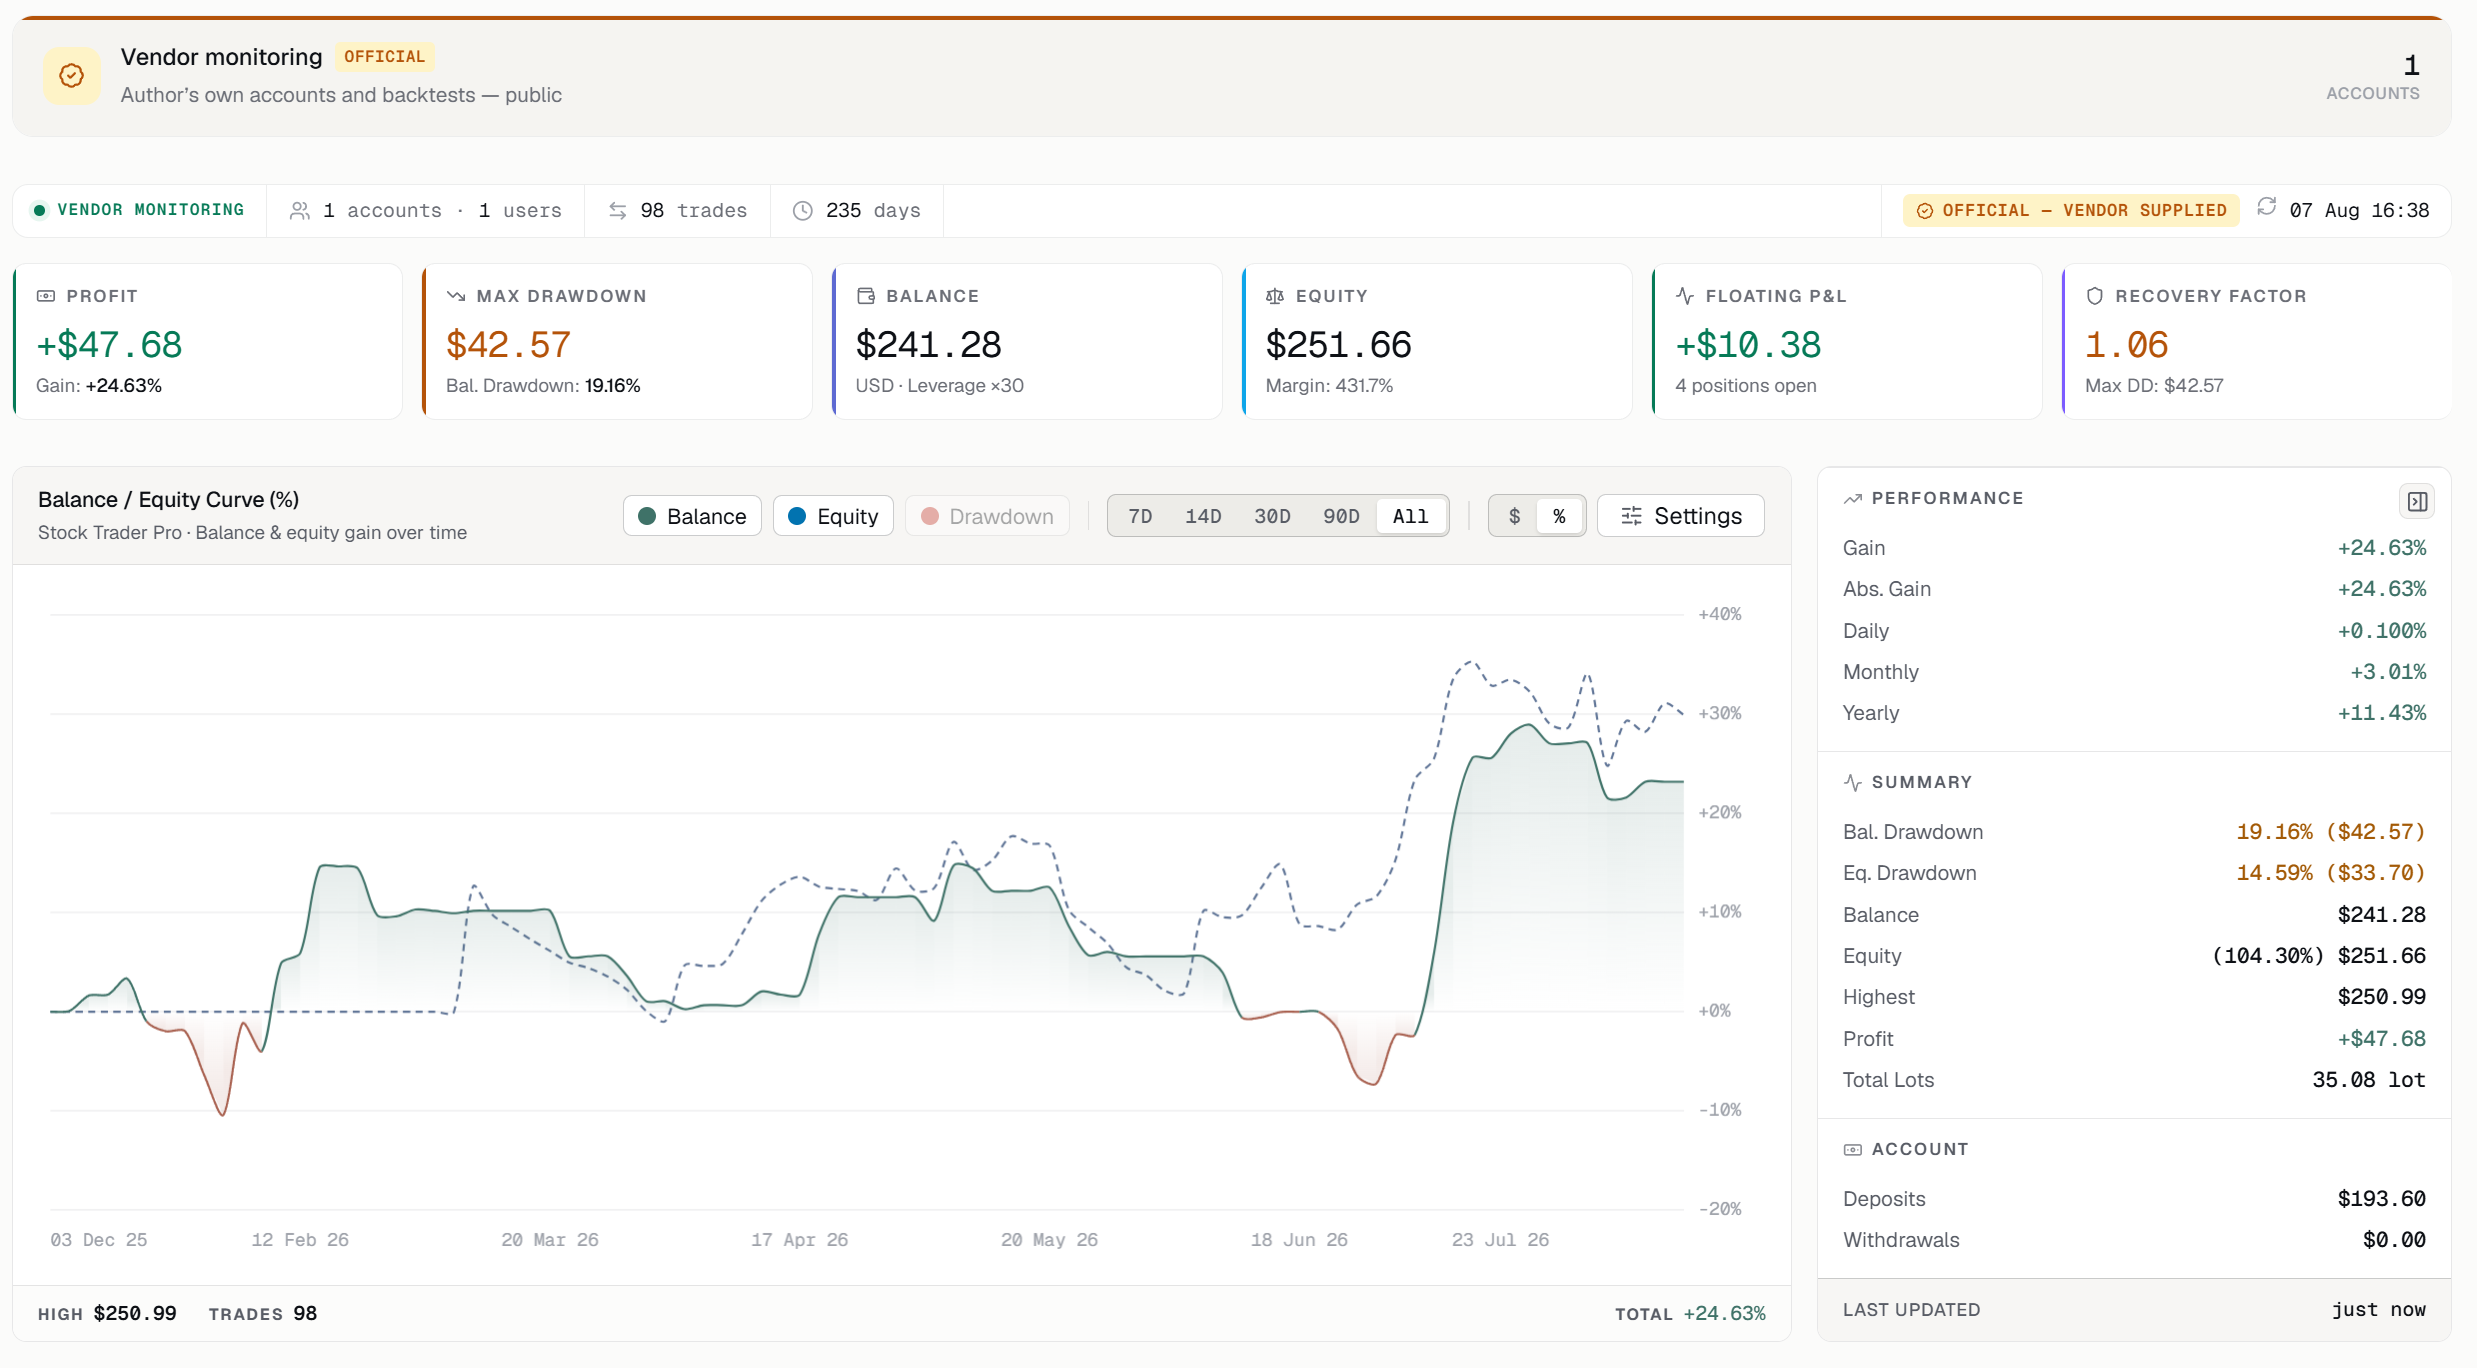
The author connects their own accounts and backtests — that is the first contour, and it is theirs to curate. The second is assembled from the accounts of buyers who switched participation on themselves. It is the one worth reading, precisely because it cannot be arranged.
- Author monitoring — connected accounts become public in full: curve, trades, broker, server. The login is never shown.
- Independent aggregate — the author cannot add a single account to it, and cannot remove one either.
- The gap between the two is stated openly: how reproducible the author's result turned out to be.
- Every buyer source is verified against the product — on adding, and then every night.
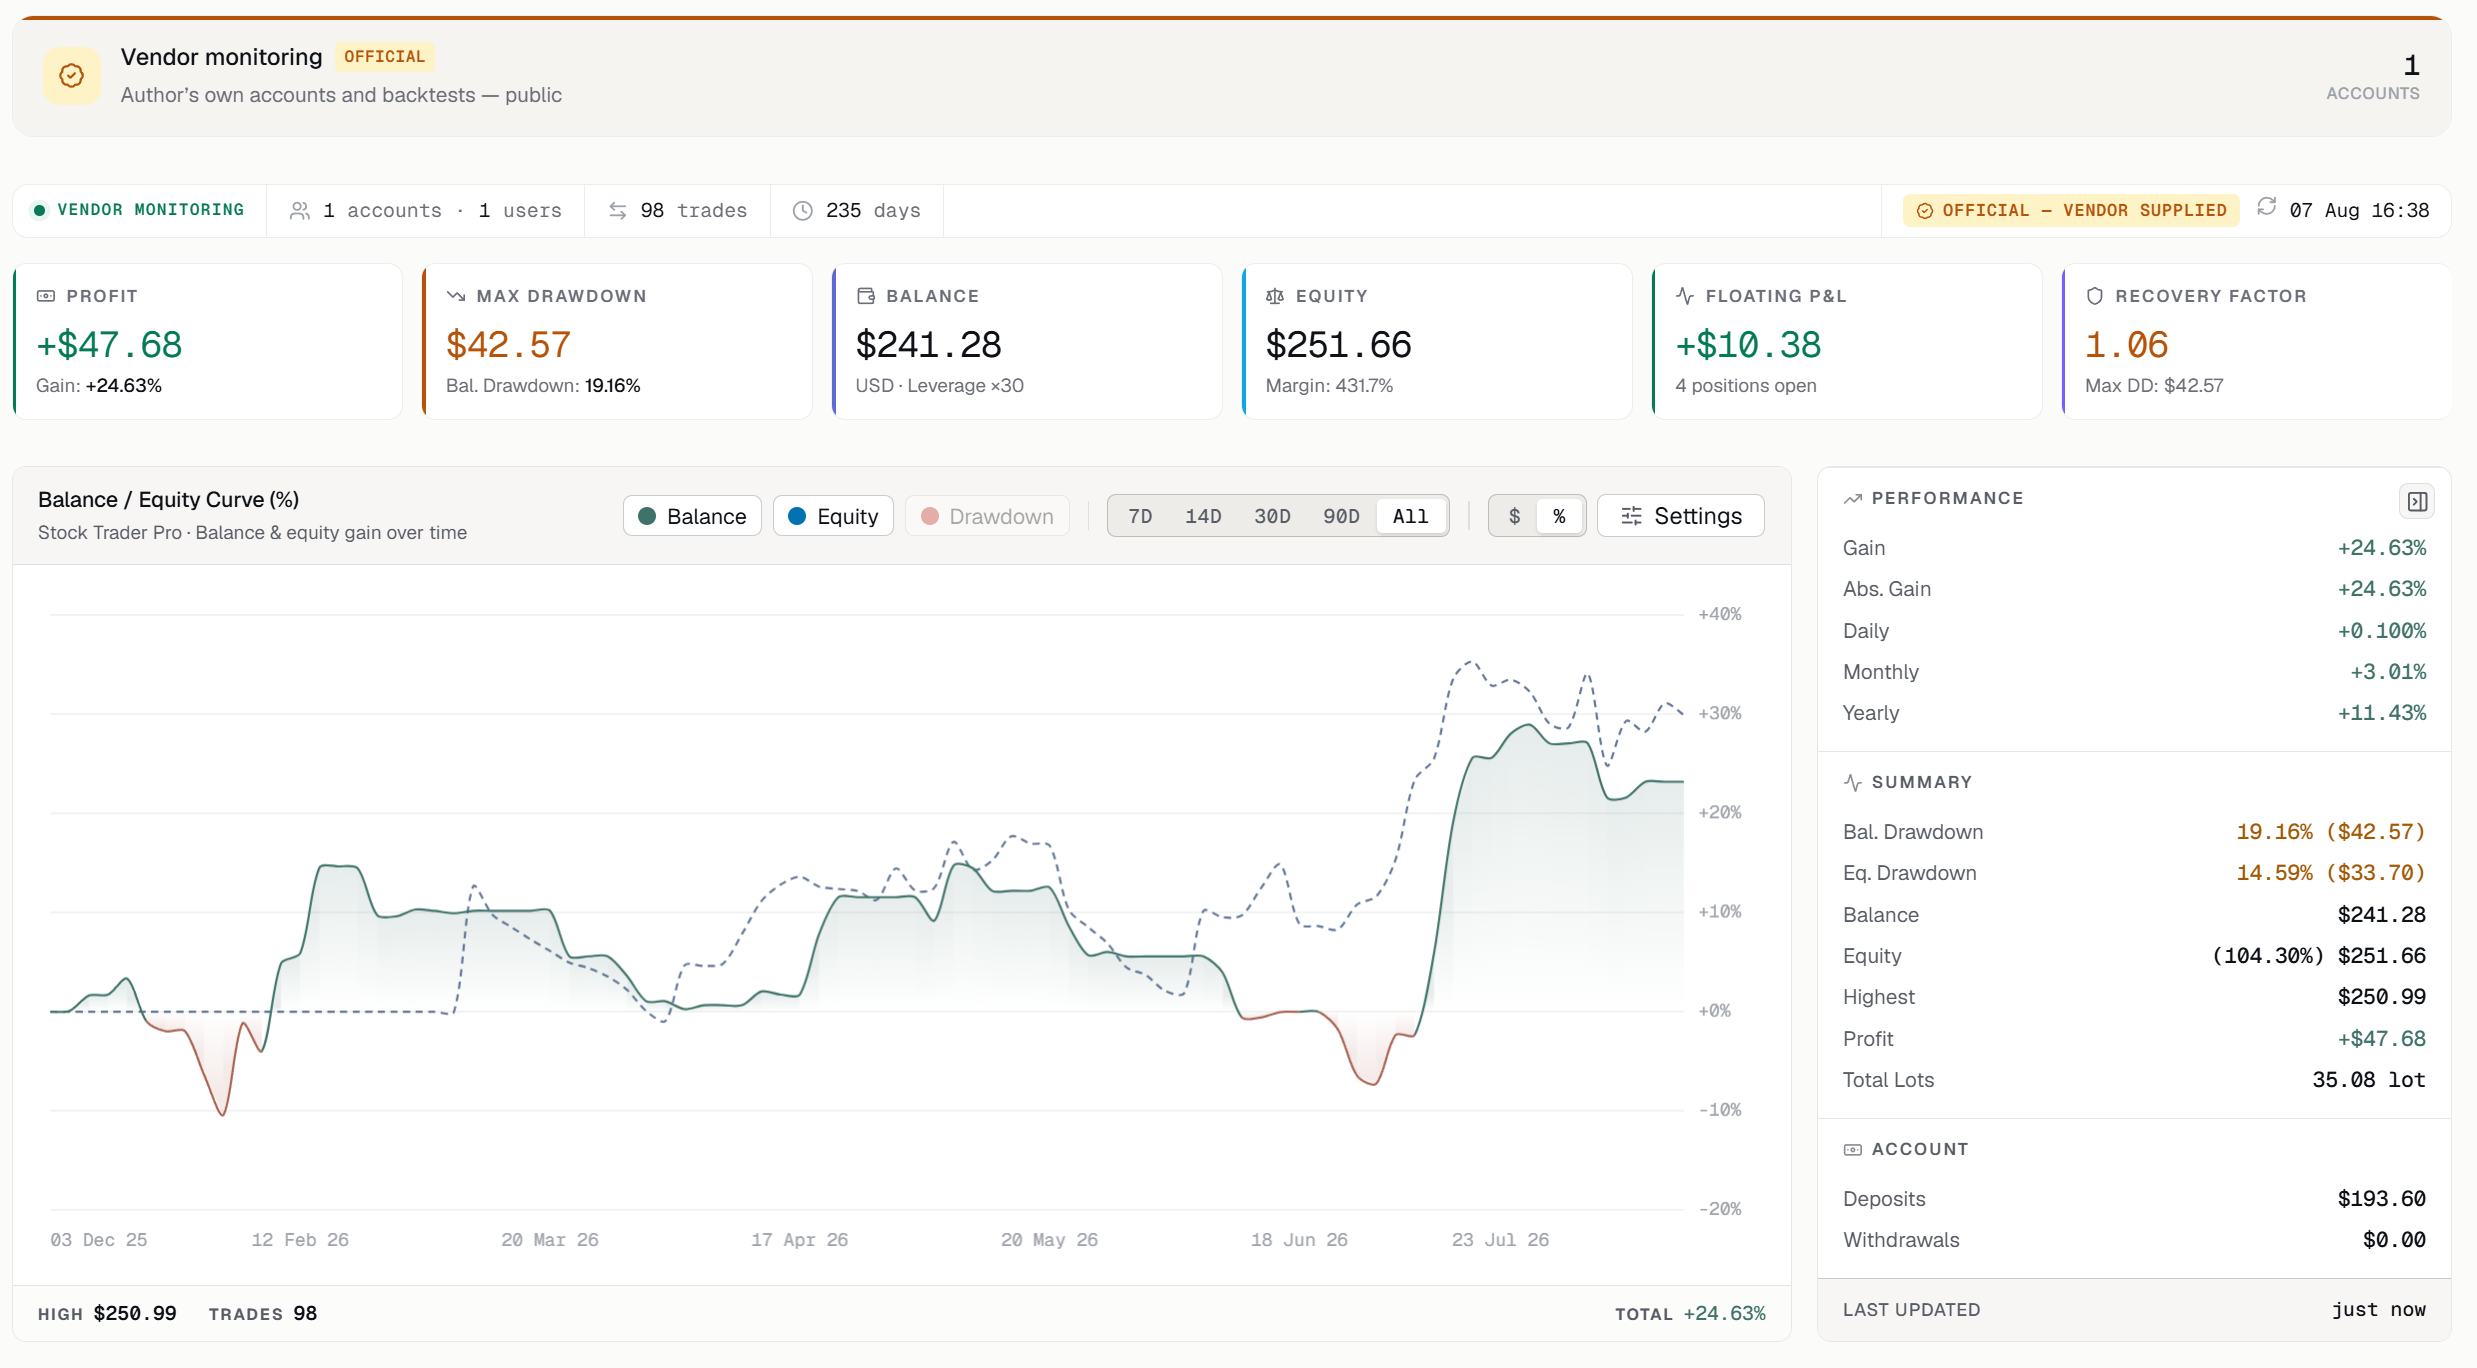
Risk is measured from trades, not read from the description
Martingale, grid, missing broker-side stop — all of it is derived from lot progression and the sequence of positions, separately for each magic series, so two advisors on one account are not mistaken for one martingale.
- A flag is raised only when the pattern is confirmed on the majority of sources: one person adding lots by hand is a property of that person.
- Declaring mechanics honestly turns a red «undisclosed risk» flag into a green «disclosure verified» one.
- Pyramiding is shown but never penalised — adding along the move is position management, not averaging into a loss.
- A flag is a flag, not a verdict: a martingale is a property of a strategy, and the reader decides what to make of it.
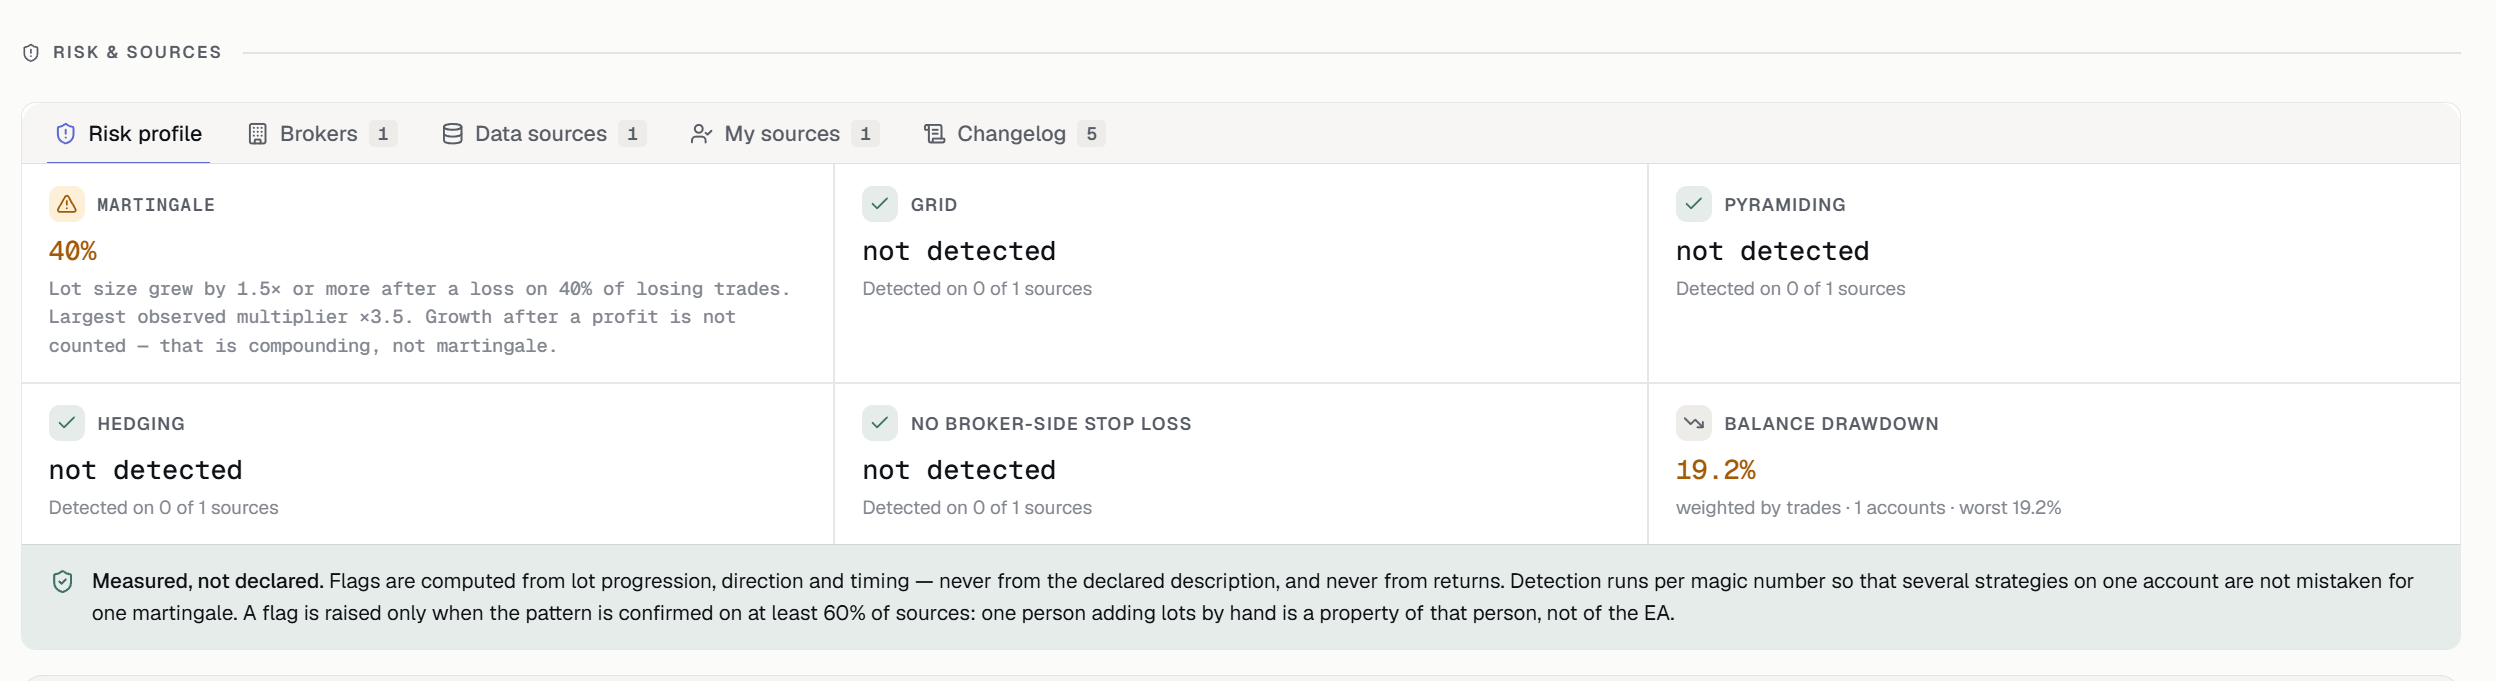
A score you can take apart
Drawdown, recovery factor, expectancy, profit factor and the share of profitable sources — each saturating, so a single outlier cannot buy the top of the table. The methodology opens in one click from the ranking, and its numbers are read from the live settings rather than retyped by hand.
- Everything is measured in R — net result over the balance at the moment the trade opened, so accounts of any size are comparable.
- The less is known about a product, the harder its score is pulled towards the catalogue median.
- Age is a multiplier, not a bonus: a product with no history simply has not had time to draw down.
- A dash means «not computed», never zero and never a guess.
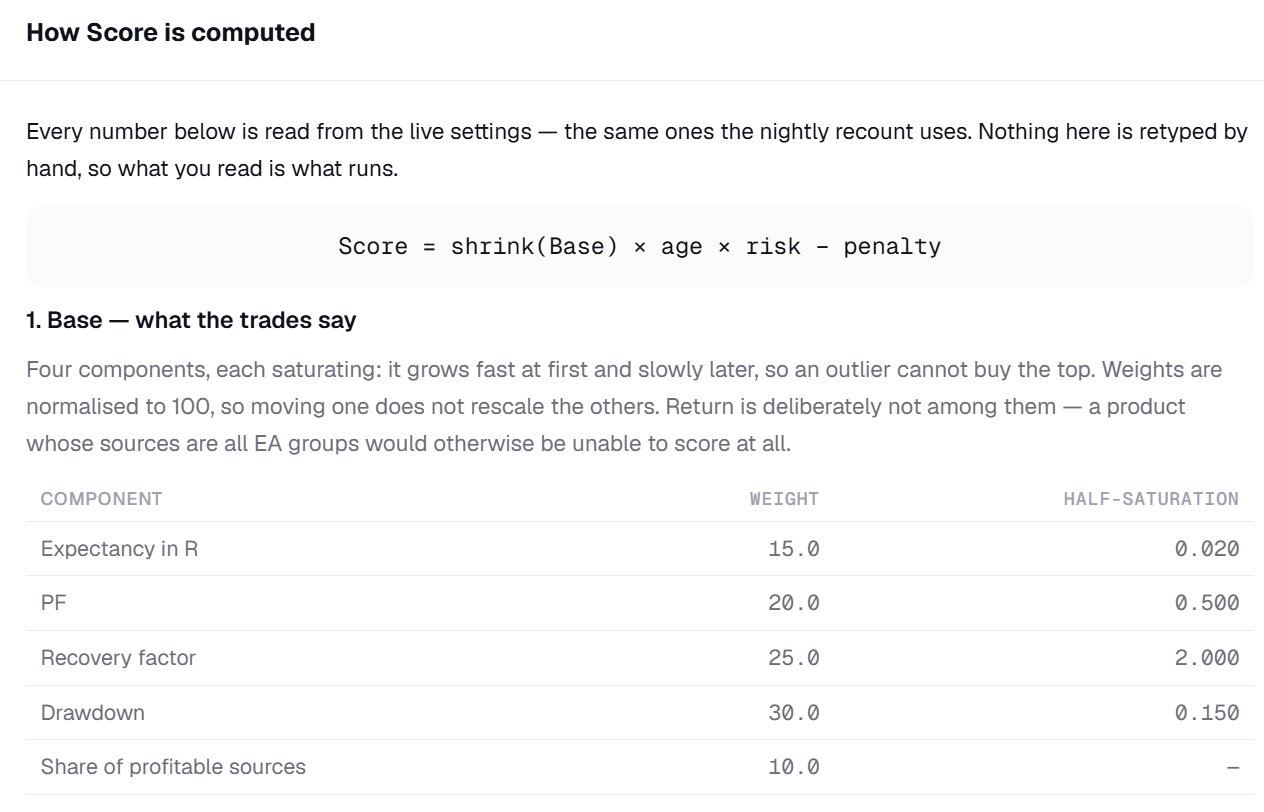
What participants actually got
Not one averaged curve but a fan of them: the median, the middle half and the tails across every account. Each one starts at zero on the first day of the window, so accounts of different age can be compared at all.
- Percentile bands over any period — the spread of outcomes rather than the best of them.
- A breakdown by broker: where exactly the same advisor works better.
- Participation publishes nothing: the curve, the trades and the account number stay private, and the author never learns who took part.
- A complaint is read by a moderator, not by a robot — and nothing about the product changes while it is being reviewed.
Three different questions, one set of data
The same numbers answer very different things depending on which side of the purchase you are on.
Buying an advisor
See what the product gave people rather than its author. Find out whether there is a martingale under the smooth curve — and how the result looks at your own broker.
Selling an advisor
Show a second source of data that you do not control. It is the strongest trust signal available, and it separates you from anyone displaying a hand-picked account.
Trading a prop account
Find out whether an advisor survives firm rules before you attach it: drawdown, behaviour of position series, presence of a broker-side stop.
What this ranking does not claim
The section is built on numbers being trustworthy, so its limits belong on this page rather than in the small print.
Past results predict nothing
Not a single figure on a card is a forecast. A strategy that worked for two years can stop working tomorrow.
The sample is skewed by survival
Participants opted in themselves. Whoever abandoned the advisor after losses is underrepresented, and we do not correct for it.
Flags are assigned by an algorithm
It can produce false positives. A flag is a reason to look closer, not proof of anything.
Two kinds of metric, never mixed
Pooled figures describe the strategy, percentile figures describe what a typical participant got. They are computed differently and are not comparable with each other.
Look at the second column
The one the seller could not choose.