Is it still trading like the backtest?
Link a backtest to the live account or EA running it, and FX Monitor tracks the divergence between expectation and reality — and warns you the moment live drifts away.
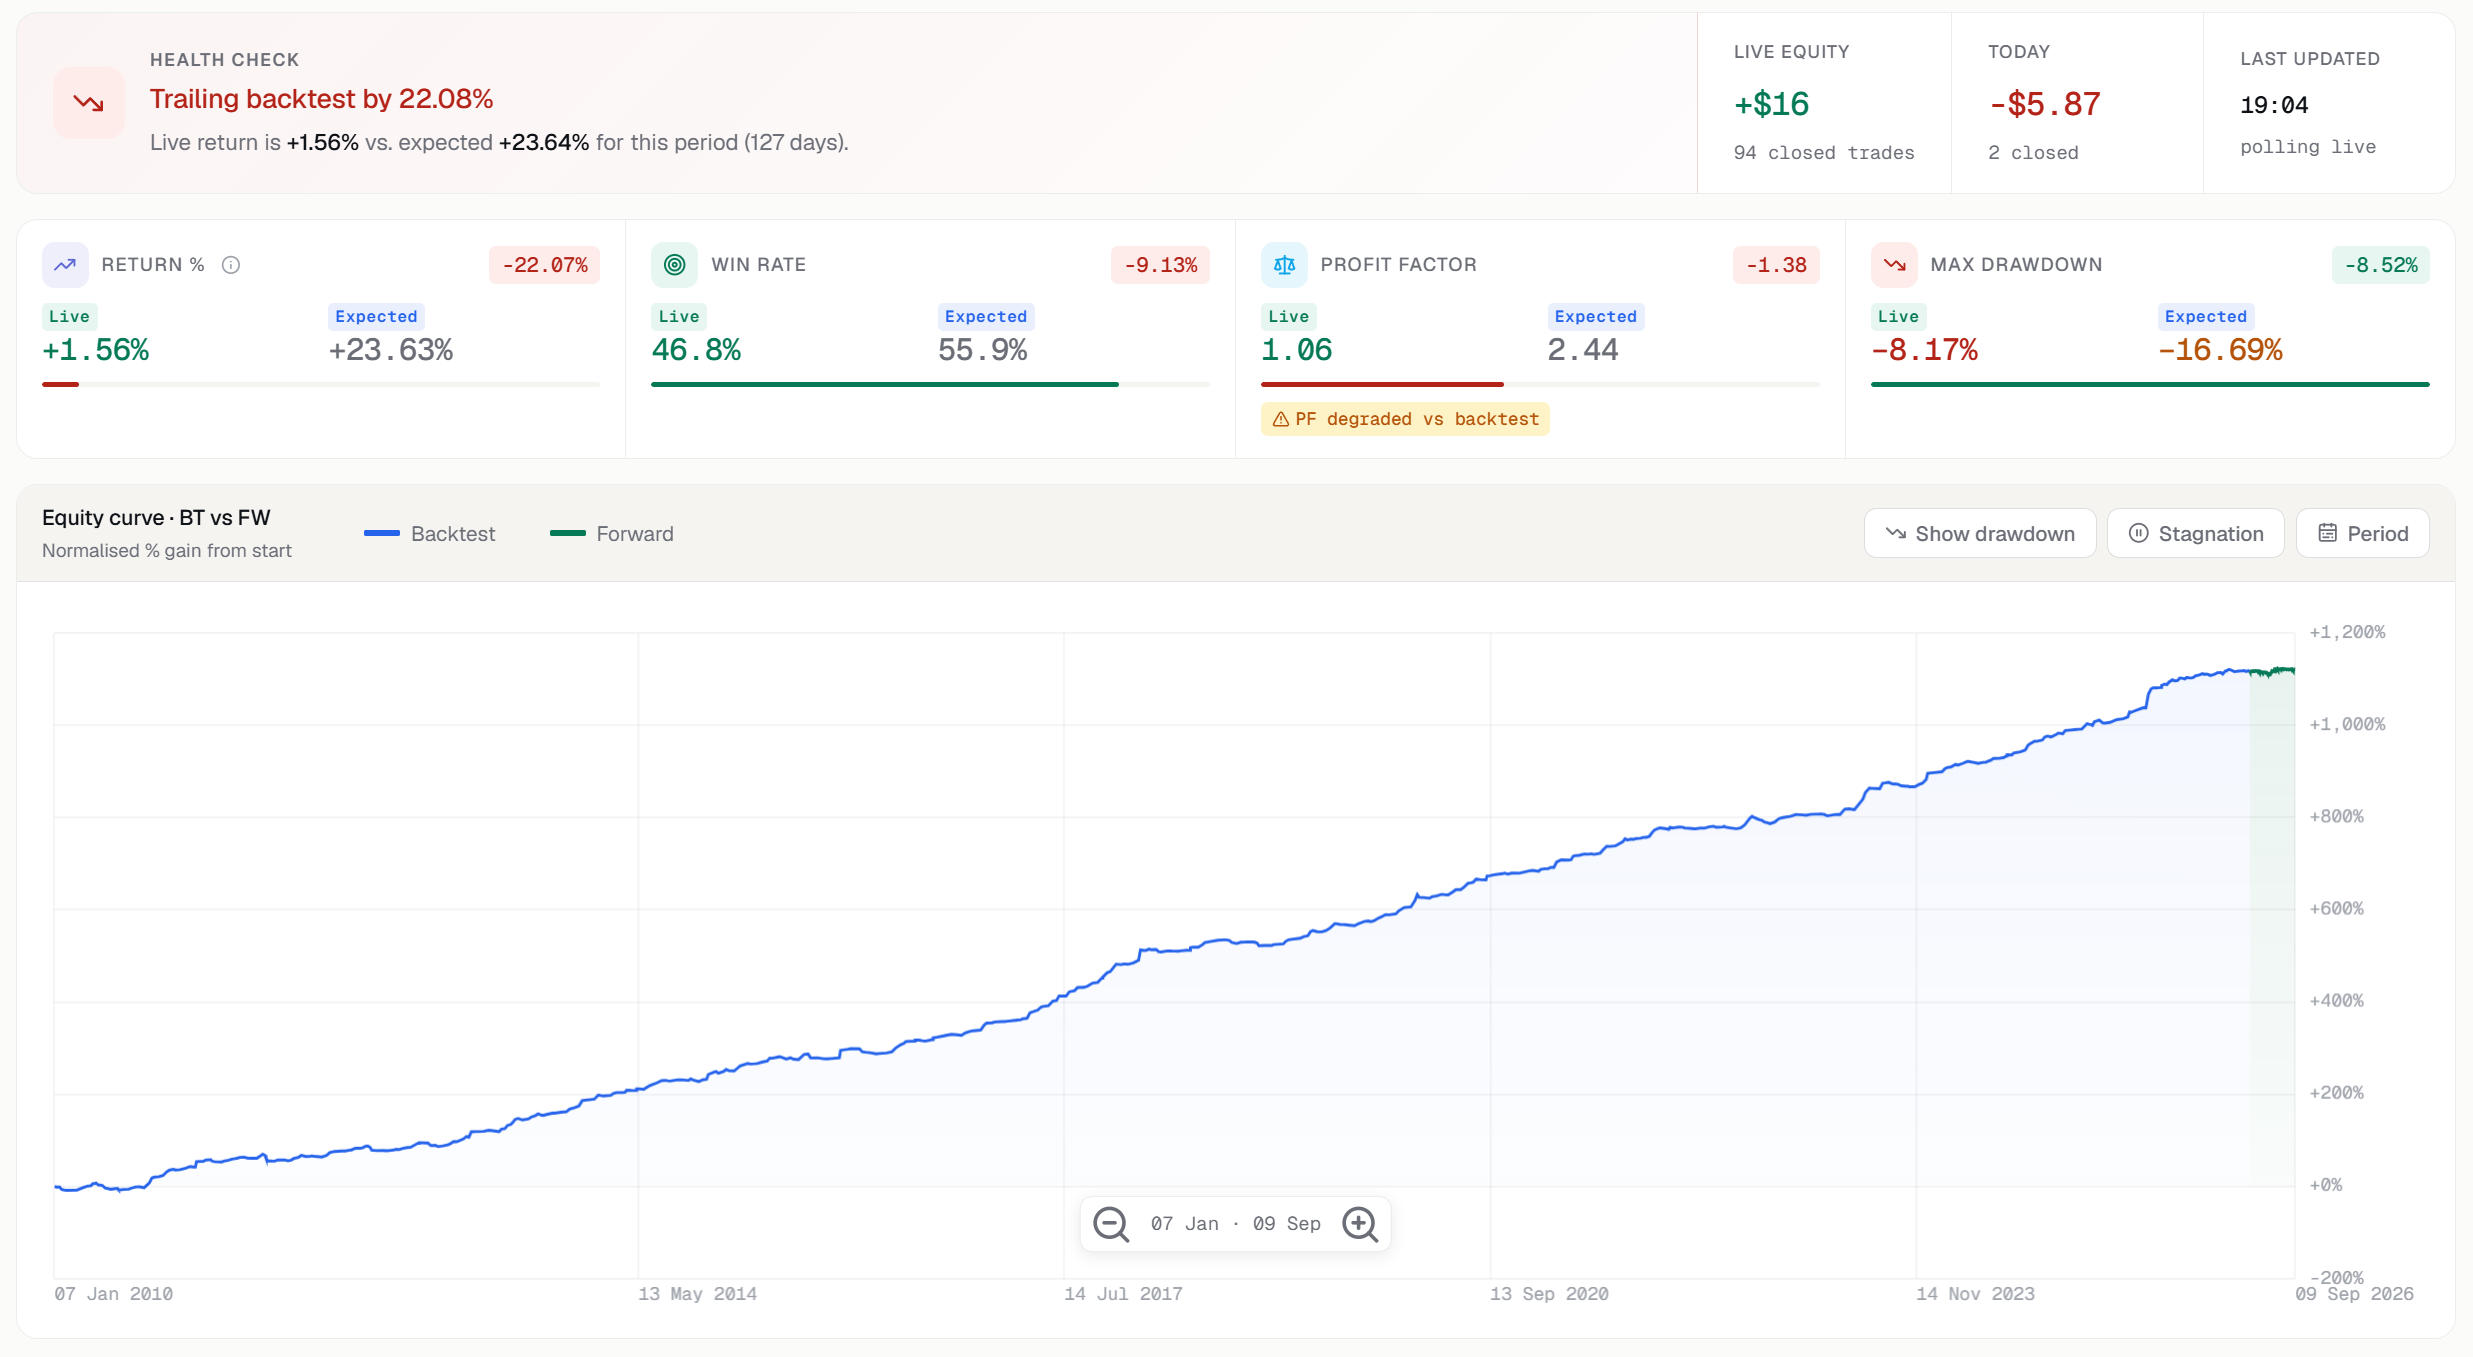
Trust, then verify.
A backtest is a promise. This checks if it’s kept.
A strategy that looked great in testing can quietly degrade live — wider spreads, slippage, changing conditions. Strategy Analysis puts the backtest and the live results side by side so you see the gap as it opens, not months later.
Backtest and live, side by side
Attach a backtest report to the live account or EA that runs the strategy. Every metric lines up in one table — backtest column, forward (live) column, and the delta between them.
- Link a single backtest or a backtest portfolio
- Backtest vs. forward columns for every metric
- Win rate, profit factor, drawdown, avg trade and more
Watch the gap open in real time
As live trades accumulate, FX Monitor measures how far reality has drifted from the backtest — by metric and over time — so a slow degradation doesn’t go unnoticed.
- Per-metric drift between backtest and live
- Expectation vs. actual equity over the live period
- See pace: ahead of, on, or behind the backtest
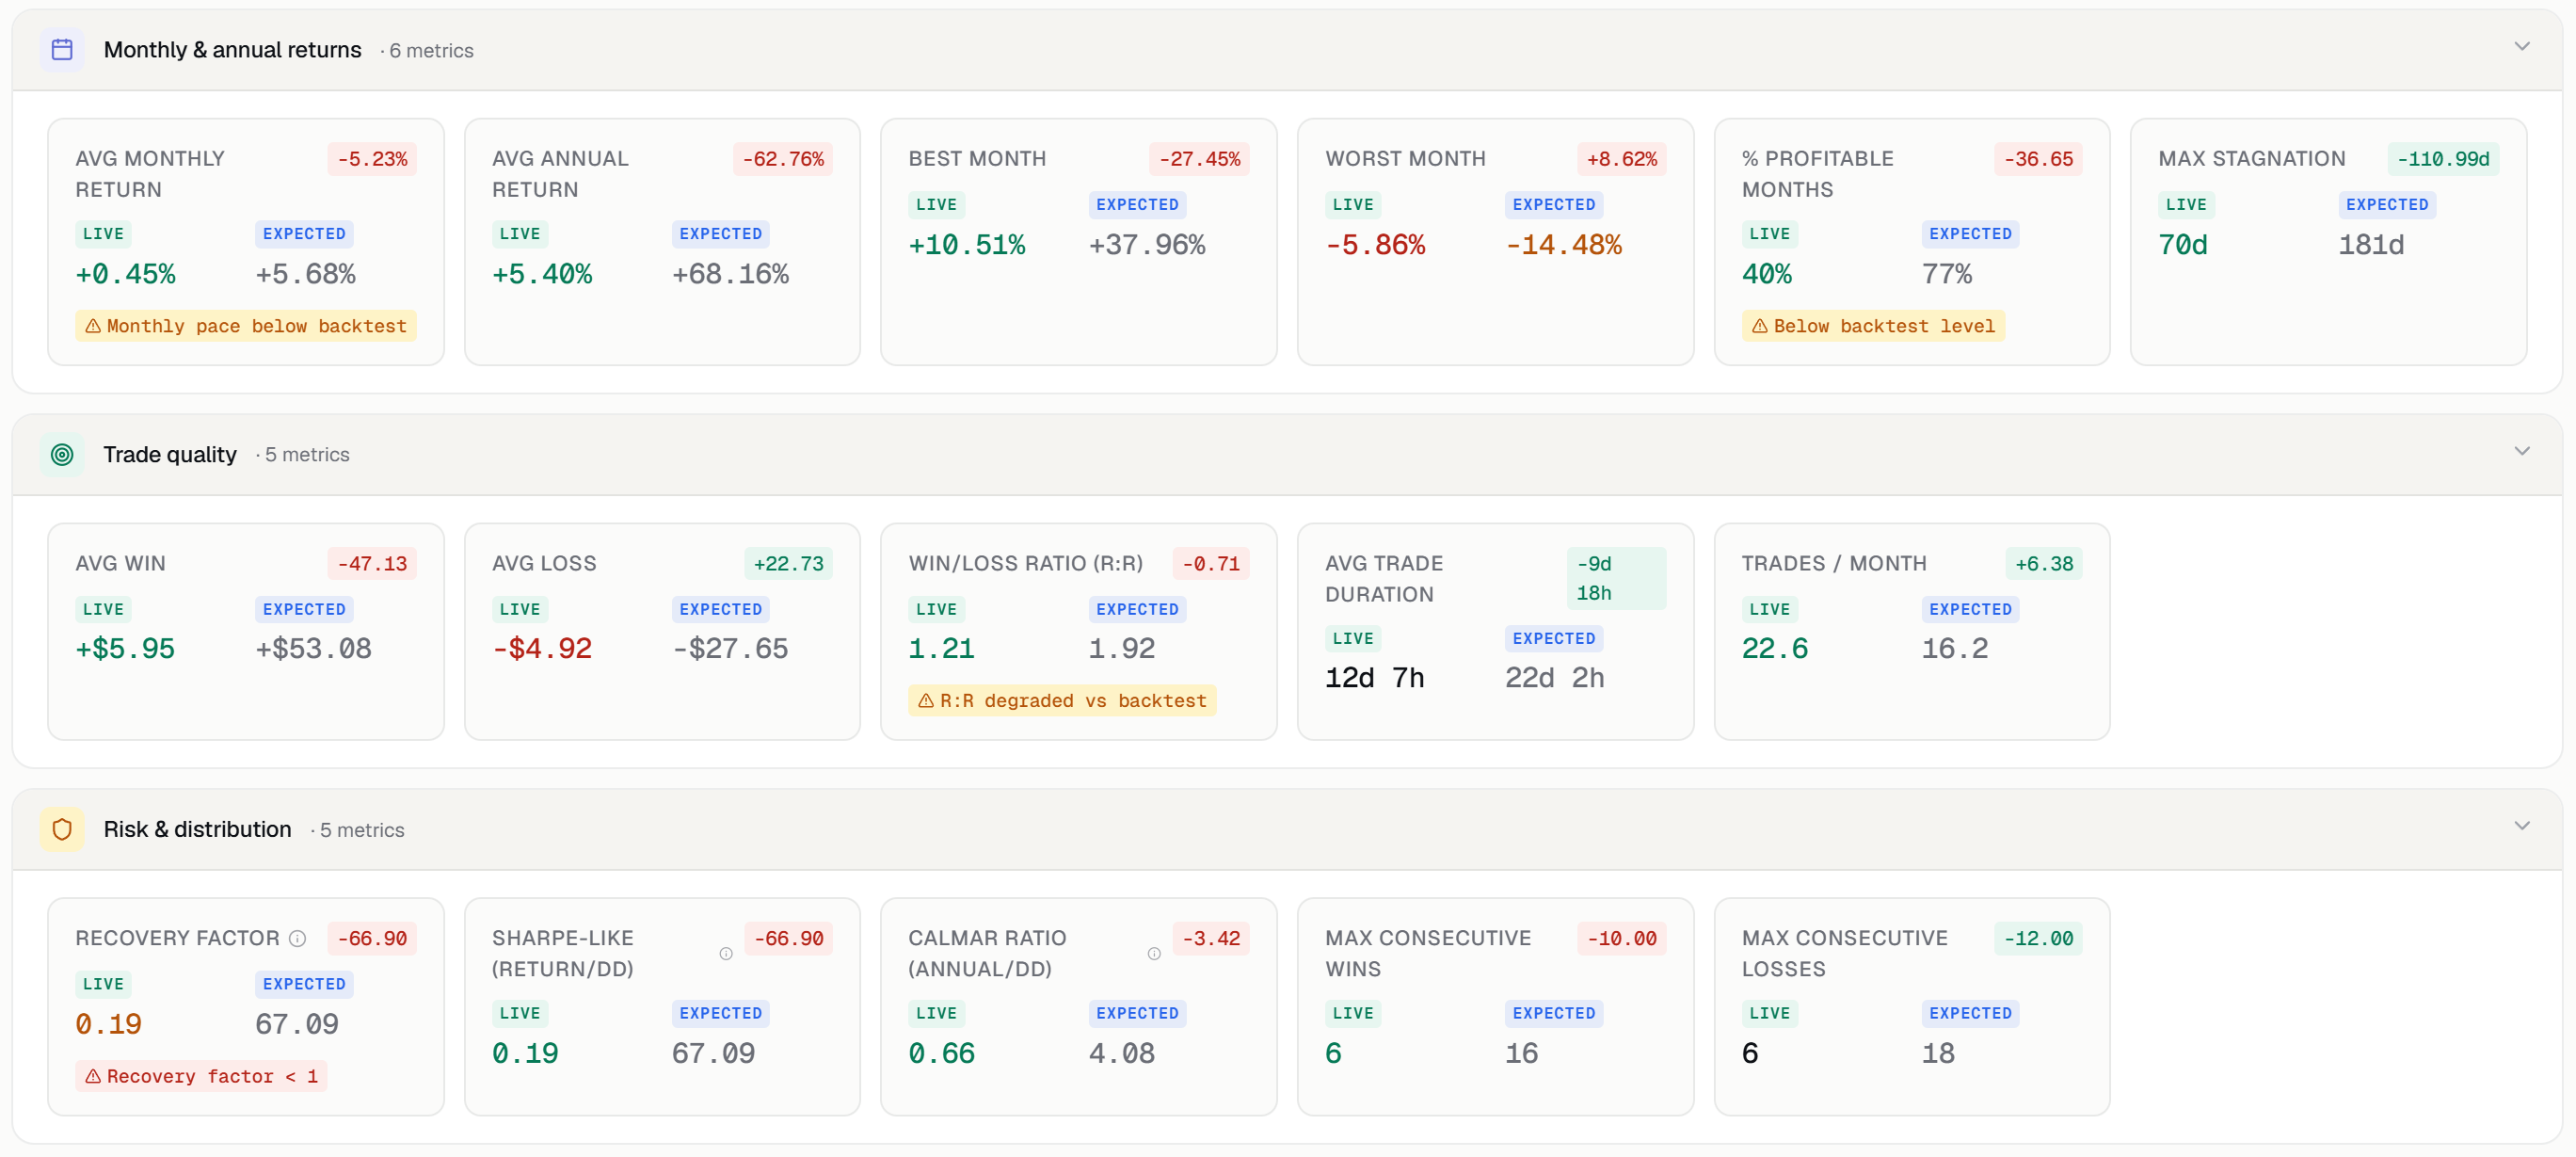
It tells you when something’s off
Instead of you watching the table, FX Monitor watches it for you and raises an alert when live behaviour breaks from what the backtest led you to expect.
Drawdown exceeded backtest
Live drawdown has passed the worst seen in the backtest.
Profit factor degraded
Live profit factor has fallen well below the backtest’s.
Win-rate drop
Live win rate is running materially under expectation.
Pace below backtest
Live is accumulating profit slower than the backtest pace.
Worse than backtest
Overall performance is tracking below the backtested curve.
Stagnation
The strategy has gone too long without progress versus test.
Trust, then verify.
Link your backtest and let FX Monitor tell you if the live strategy is keeping its promise. Free to start.