Analytics now includes Slippage. It analyzes slippage on your real accounts and turns it into money.
What’s inside
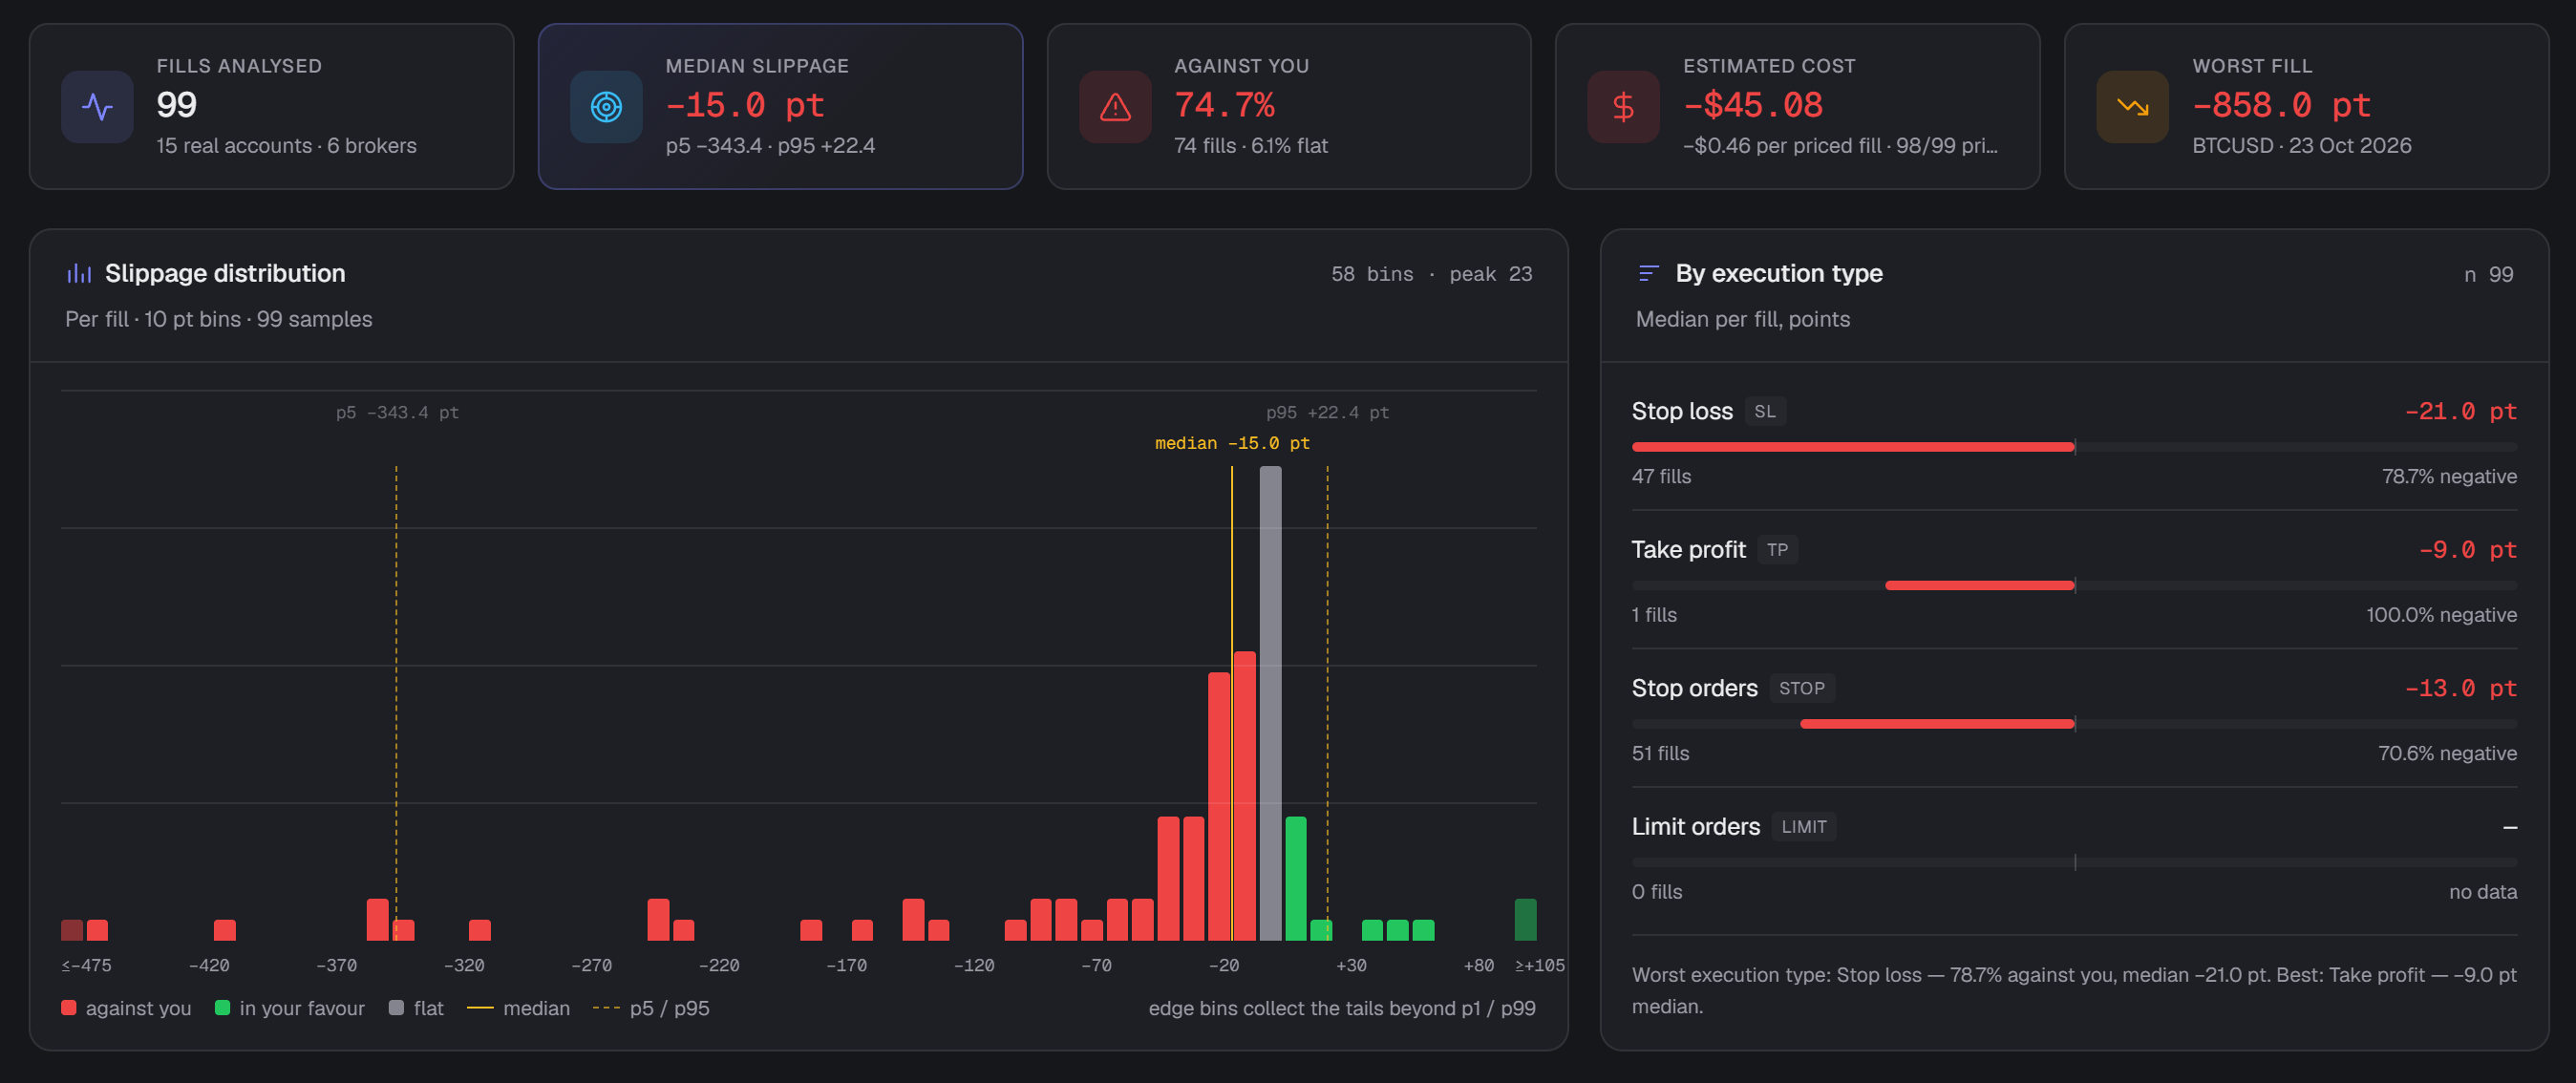
- median, p5/p95 and the share of fills against you;
- breakdown by account, broker, symbol and execution type (SL, TP, stop, limit);
- distribution histogram and daily trend with cumulative cost estimate;
- 7/30/90 days, one year, all time or a custom range;
- CSV export under the current filters.
What to do with it
Compare your brokers on your own trades, find the most expensive symbols and order types, and after making changes come back in 7–30 days to check the result.
How the cost estimate works. It uses the P&L of the trade itself per point of movement; if there’s no closed trade yet, it falls back to the average for the same account and symbol. Cent accounts are normalized, and the total is converted to USD at today’s rate.
Good to know. Only real accounts and executions with a known expected price are included: closes by SL/TP and triggered stop/limit orders. Market orders can’t be measured, so the dollar figure is an estimate based on this subset of trades, not a broker statement. The section does not provide investment advice.
Where to find it: Analytics → Slippage